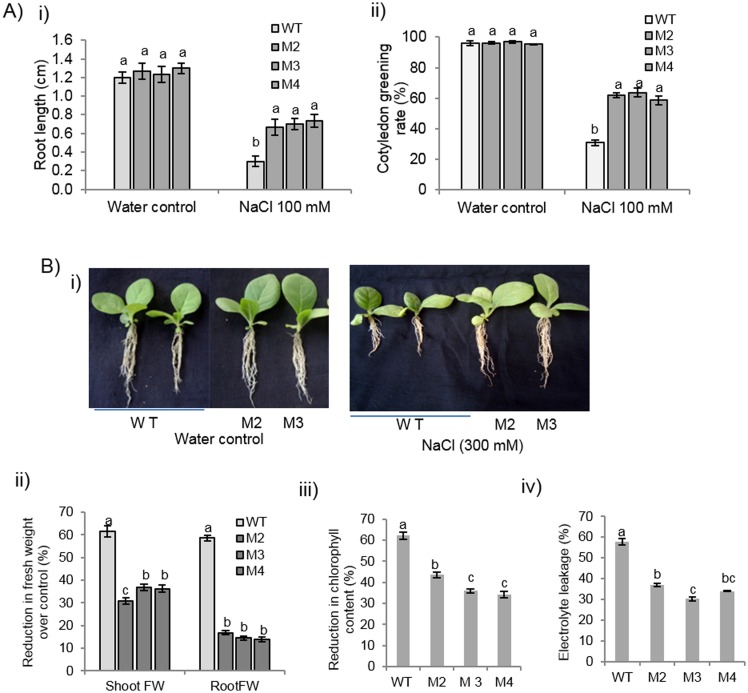
Fig 4. Response of EcbHLH57 expressing transgenic plants for salinity stress tolerance.
A) Root length and cotyledon greening rate of EcbHLH57 expressing transgenic and wild type seedlings under 100mM NaCl treatment. Graph depicting i) Root length and ii) Cotyledon greening rate of transgenic and wild type plants. B) 30-day-old plants were treated with 300 mM NaCl for 1 week. i) Root growth comparison of transgenic and wild type plants. ii) Per cent reduction in shoot and root fresh weight of plants over water control iii) Percent reduction in chlorophyll content. iv) Electrolyte leakage under NaCl treatment. Data represent mean of three replications (n = 3) and bars indicate standard error. The lowercase letters that are different indicate significant difference (Duncan’s multiple range test, P<0.05) between transgenic and wild type plants exposed to same treatment. WT- wild type. M2, M3 and M4- transgenic lines expressing EcbHLH57.

