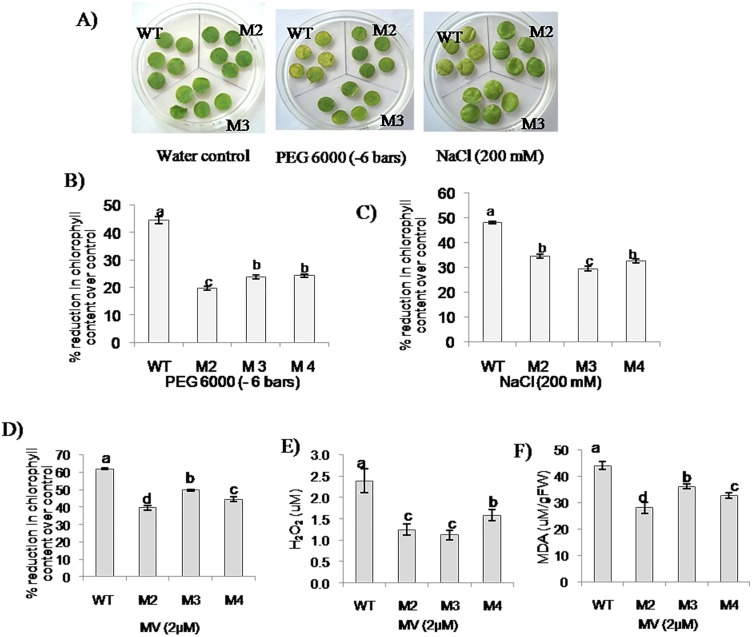
Fig 5. Response of EcbHLH57 expressing transgenic plants to PEG, NaCl and MV induced stress.
Leaf discs from wild type and transgenic plants were placed on half MS medium supplemented with PEG 6000 (-6 bars), NaCl (200 mM) and MV (2 μM). A) Photograph taken 72 h after exposure to treatment. Leaf discs were analyzed for per cent reduction in chlorophyll content over water control under, B) PEG, C) NaCl and D) MV treatments. Analysis of, E) H2O2 content using xylenol orange assay and, F) MDA content using TBARS assay in MV treated leaf discs. Data represent mean of three replications (n = 3) and bars indicate standard error. The lowercase letters that are different indicate significant difference (Duncan’s multiple range test, P<0.05) between transgenic and wild type plants exposed to same treatment. WT- wild type. M2, M3 and M4- transgenic lines expressing EcbHLH57.

