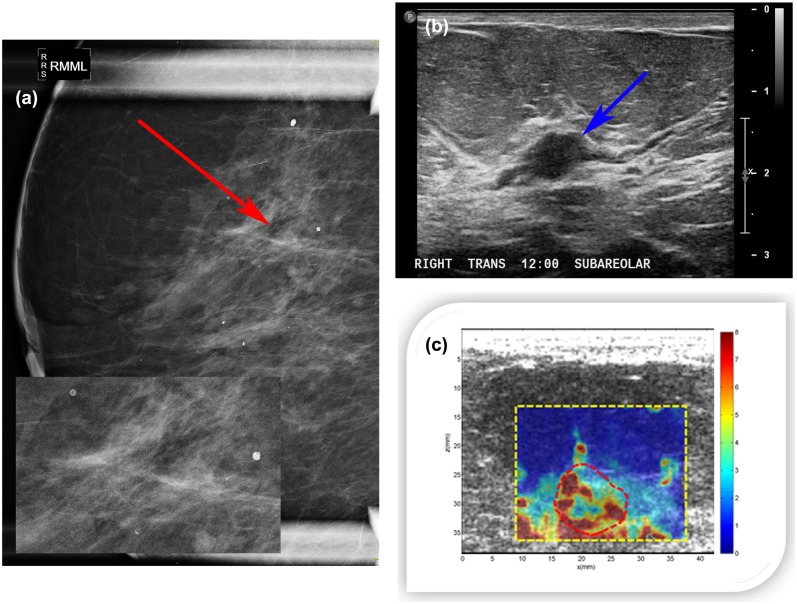
Fig 12.
(a) Right breast magnification mediolateral mammogram showing heterogeneous dense tissue with a mix of macrocalcifications and linear microcalcifications (red arrow). (b) B-mode ultrasound of the right breast revealing a 9×6×11mm hypoechoic intraductal mass (blue arrow). (c) CUSE image showing high shear wave speed in some areas within the mass. The color bar indicates the speed of the shear wave.

