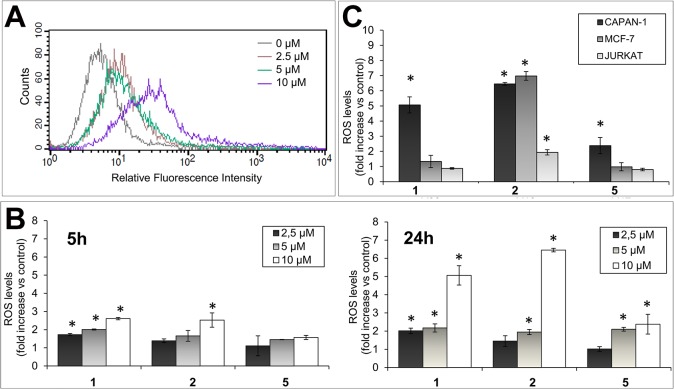
Fig 6. Oxidative activity of ligands.
(A) CAPAN-1 cells were incubated with 0, 2.5, 5 or 10 μmol/L of compound 1 for 24 h and intracellular ROS levels were determined with H2DCFDA staining. Histogram shows the dose-dependent increase of the probe fluorescence intensity. (B) ROS levels (relative to untreated cells) after exposing CAPAN-1 cells to the indicated concentrations of compounds 1, 2 or 5 for 5 or 24 h. (C) ROS levels (relative to untreated cells) after exposing CAPAN-1, MCF7 and JURKAT cells to 10 μmol/L of 1, 2 and 5 for 24 h. Differences versus untreated control cells were considered significant at *p < 0.05. Data represents the mean±SD from 3 independent experiments.

