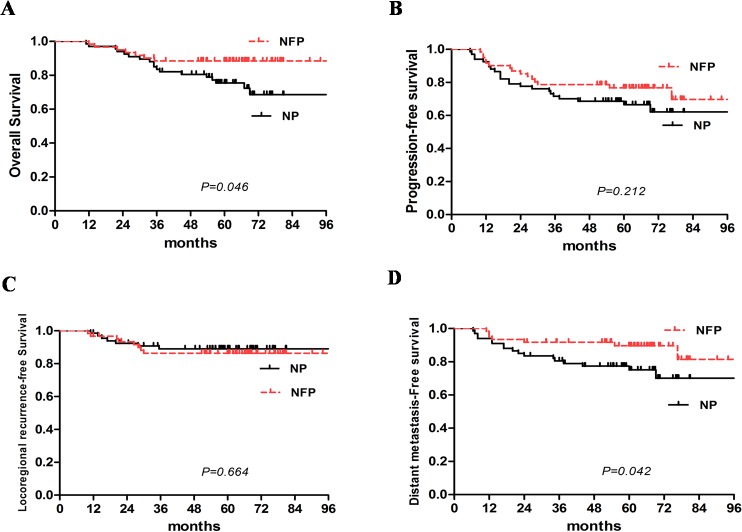
Fig 3. 5-year OS, PFS, LRRFS and DMFS were 75.4% vs. 88.5%, 66.6% vs. 76.7%, 89.0% vs.86.3%, and 75.1% vs. 89.0% for the NP and NFP groups, respectively.
A and D. Advanced N2-3 stage NPC patients in the concurrent NFP group had a significantly superior OS and DMFS (Log Rank test, OS: χ2 = 3.973, P = 0.046; DMFS: χ2 = 4.130, P = 0.042). B and C. No significant difference in PFS and LRRFS were seen during the observation period. (Log Rank test, PFS: χ2 = 1.560, P = 0.212; LRRFS: χ2 = 0.189, P = 0.664).

