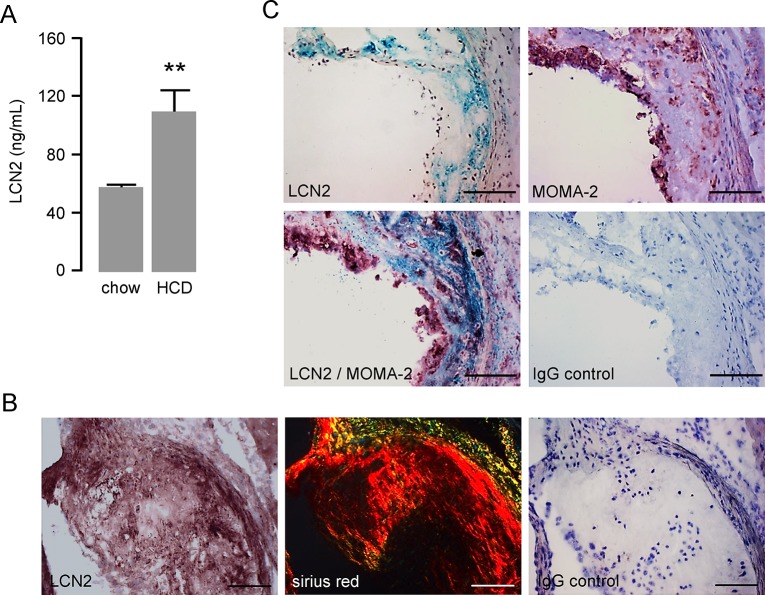
Fig 6. Hypercholesterolemic mice reveal pronounced LCN2 levels in blood plasma and atherosclerotic lesions.
(A) LCN2 plasma levels of ldlr −/− mice fed a high fat, high cholesterol diet (HCD) and of ldlr −/− mice fed a normal chow diet (chow) over a period of 24 weeks were quantified by ELISA. **P<0.01 vs. control, n = 5–10 animals. (B) Consecutive cross sections of the aortic root dissected from ldlr −/− mice 24 weeks after feeding a high fat, high cholesterol diet were stained for LCN2 and Picrosirius Red. For the distinction of different collagen fibres pictures were taken using polarized light. Scale bar = 100 μm. (C) Cross sections of the aortic root from ldlr −/− mice 24 weeks after feeding a high fat, high cholesterol diet were stained for LCN2 or MOMA-2 or double stained for LCN2 and MOMA-2. Sections were counterstained with hematoxylin. Scale bars = 100 μm. Representative pictures are shown.

