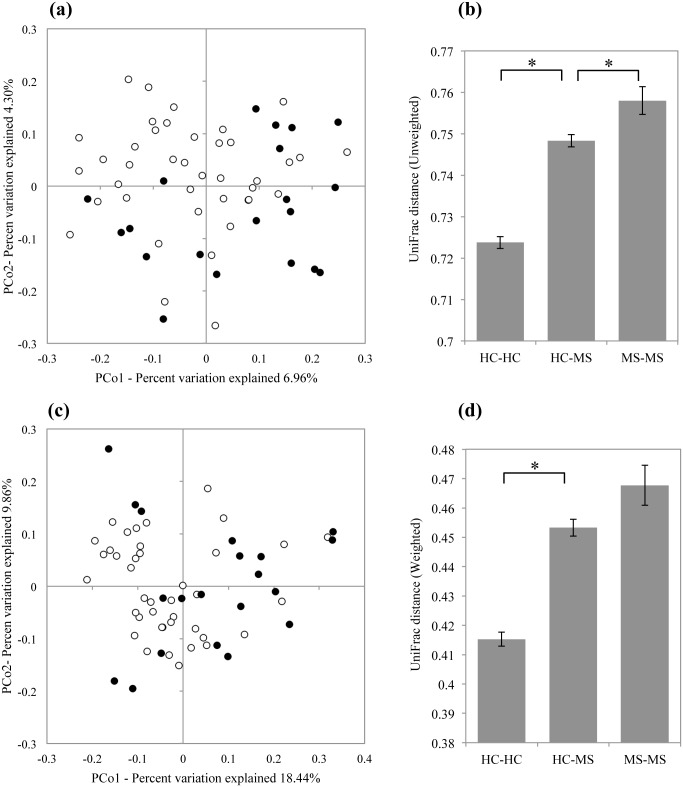
Fig 2. UniFrac Principal Coordinate (PCoA) and UniFrac distance analyses for HC40 and MS20 subjects.
(a, c) Open and closed circles indicate individual subjects from HC40 and MS20, respectively. (a) The two components of the unweighted PCoA plot explained 6.96% and 4.30% of the variance. ANOSIM statistic, R = 0.239, P ≤ 0.0009. (b) Mean unweighted UniFrac distances for HC-HC, HC-MS, and MS-MS subjects. (c) The two components of the weighted PCoA plot explained 18.44% and 9.86% of the variance. ANOSIM statistic, R = 0.208, P ≤ 0.002. (d) Mean weighted UniFrac distances for HC-HC, HC-MS, and MS-MS subjects. (b, d) Error bars represent standard deviations of the UniFrac distances between samples. *P ≤ 0.05.

