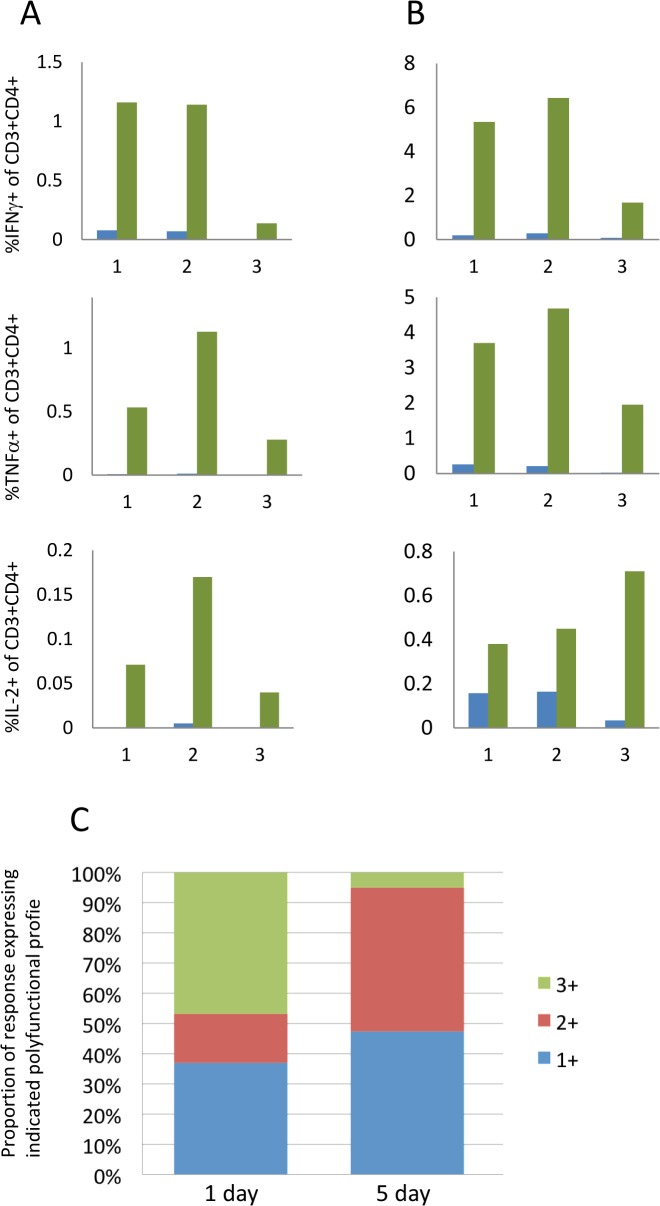
Fig 7. The impact of stimulation period on the magnitude of intracellular cytokine responses detected and polyfunctional profile of CD4+ T-cells.
PBMC were stimulated with either HBHA (A) or PPD (B) for 1 day (blue bars) or 5 days (green bars). BFA and monensin were added for the final 18 hours. Results are shown for 3 individuals indicated on the X axes. Y axes represent the percent of live, single CD3+CD4+ lymphoid cells that are positive for the indicated cytokine. (C) Boolean gating was used to determine the polyfunctional profile of cells responding to PPD following 1 day or 5 days of stimulation. The key refers to the number of cytokines co-expressed by the proportion of cells represented (green, triple positive cells; red, double positive cells; blue, single positive cells).

