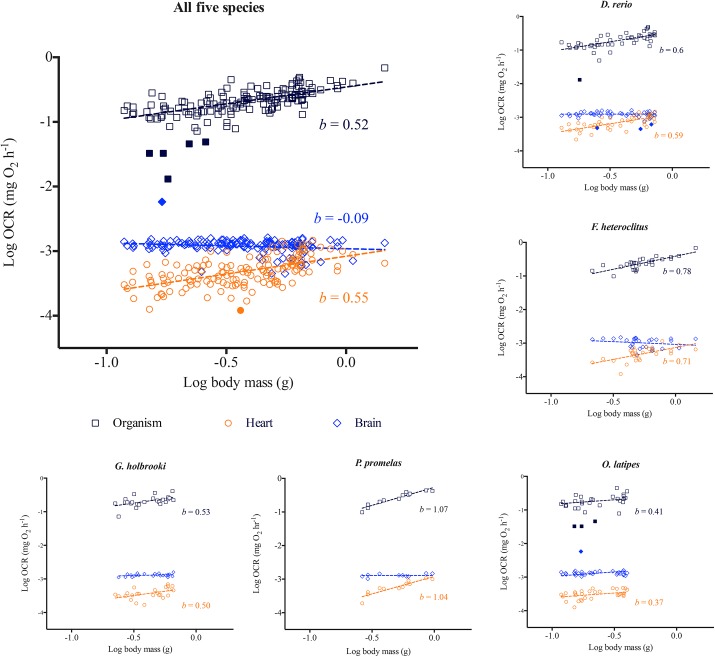
Fig 1. Whole organismal, heart and brain oxygen consumption rate (OCR) scaling relationship with body mass.
Log of oxygen consumption rates measured for whole organisms and for isolated hearts and brains from each fish are plotted against log of body mass for (a) all five species (n = 143), (b) Danio rerio (n = 48), (c) Fundulus heteroclitus (n = 28), (d) Gambusia holbrooki (n = 25), (e) Oryzias latipes (n = 30), and (f) Pimephales promelas (n = 12). Regressions were conducted across each data set based on least-squares test. b is the scaling exponent. Standard error, 95% confidence interval and R 2 values and the scaling exponent b for brains for individual species are included in Table 2 and S3 and S4 Tables. Filled symbols represent outliers determined by the linear regression model.

