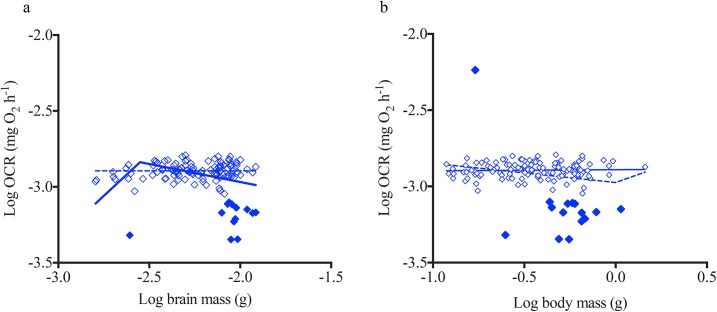
Fig 4. Brain metabolic scaling relationship with size.
Log of basal oxygen consumption rate (OCR) for isolated brains is plotted against (a) log of isolated brain mass and (b) log of body size for all five species (n = 130). Non-linear straight line and segmental regressions were conducted across each data set based on least-squares test. Filled symbols represent outliers determined by the linear regression model.

