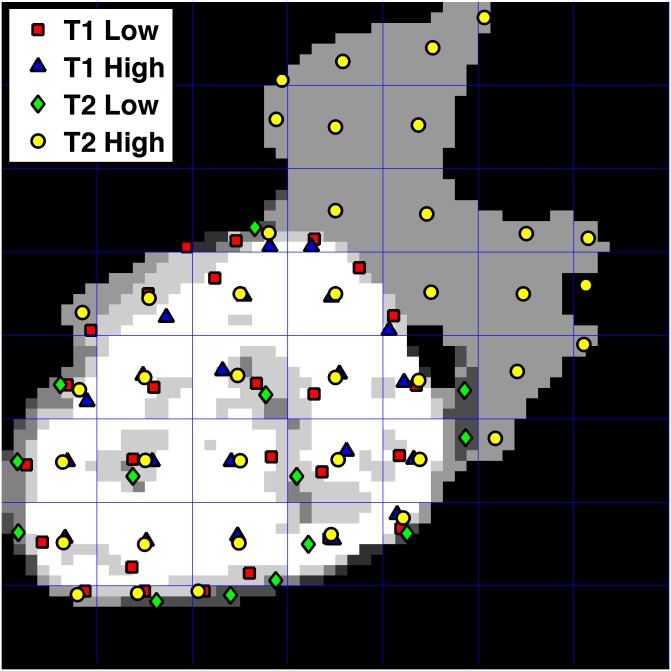
Fig 3. A sample ROI spatial map.
A spatial map was combined with the low-intensity T1 post-contrast ROI, high-intensity T1 post-contrast ROI, low-intensity T2 FLAIR ROI, and high-intensity T2 FLAIR ROI. Each binary mask is equally divided into several bounding boxes and the size of each bounding box is 8×8 pixels. The coordinates of each centroid indicating the center of mass of each group inside of the small bounding grid box were calculated, and coordinates from all four regions were combined into a spatial map. The centroids of each subpopulation are designated by four different shapes based on group to illustrate the spatial relations between the four groups. Different gray levels of ROI represent each habitat and overlaps of habitats.

