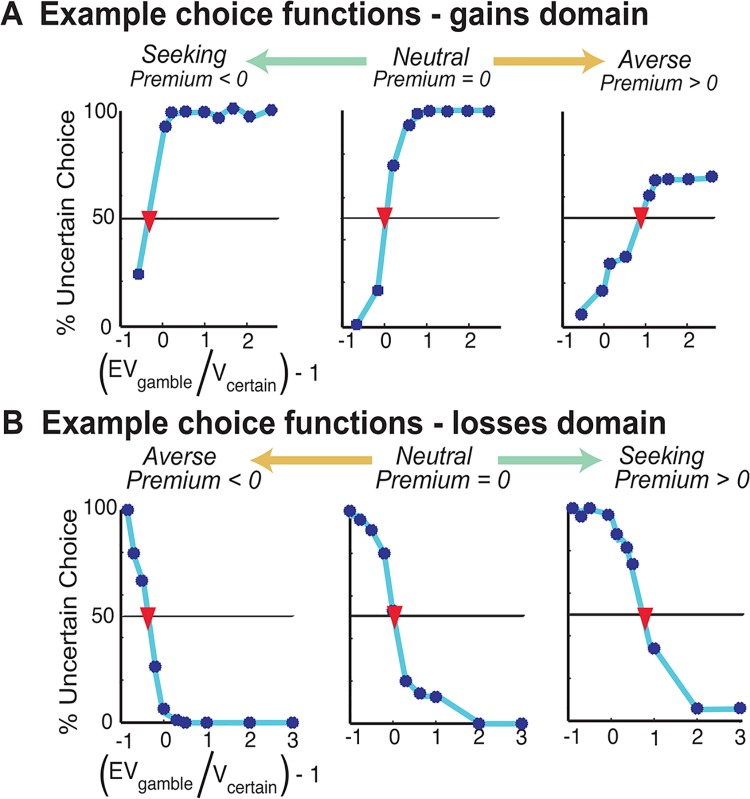
Fig 3. Example choice functions.
(A) In the gains domain, the range of risk preferences is represented on a continuum from risk seeing (left) to risk averse (right). The indifference point of each choice function is marked with a red inverted-triangle. Risk premium is determined by the value on the ‘(rEVG / Vc) -1’ (x-axis) at this indifferent point. (B) In the losses domain, the range of risk preferences is represented on a continuum from risk averse (left) to risk seeking (right).

