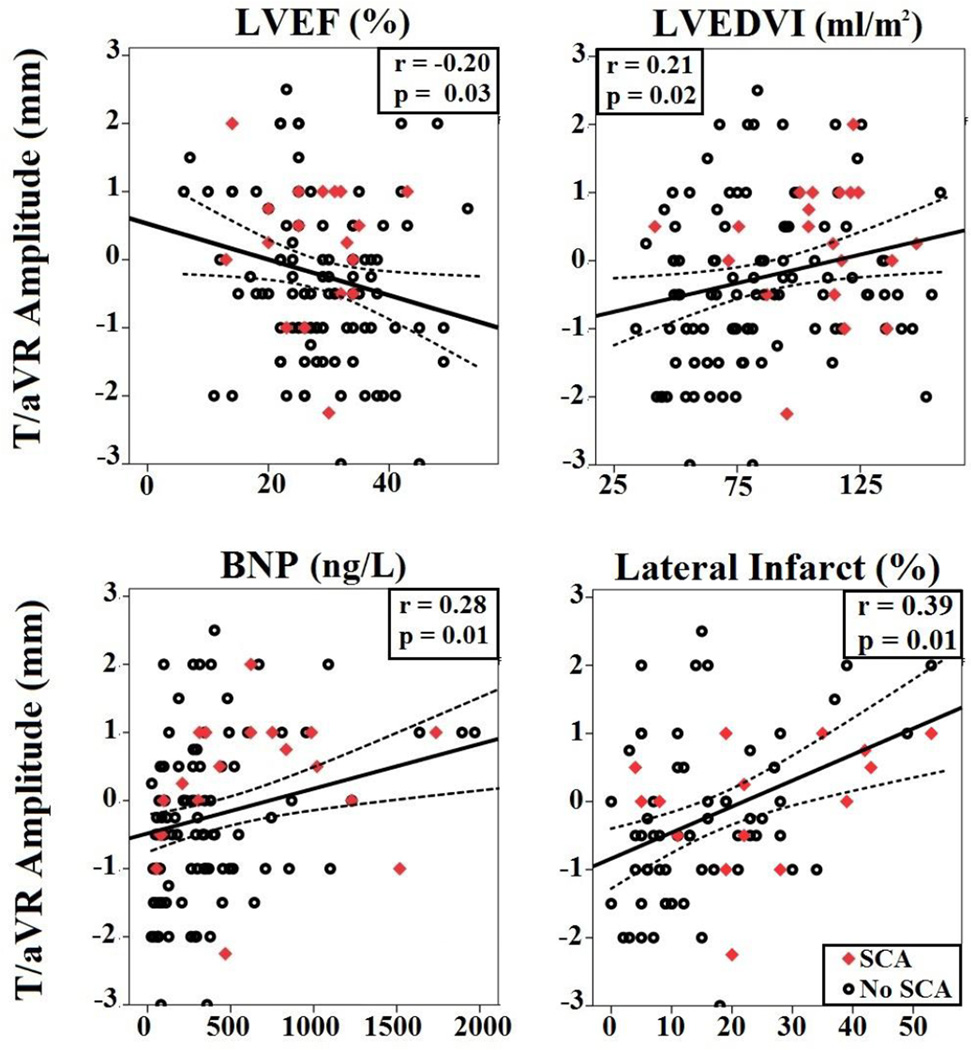
Figure 2. Physiologic Correlates of T/aVR Amplitude.
Best-fit linear regression line and its 95% CI of the mean between T/aVR amplitude (mm) and left ventricular ejection fraction (LVEF [%], upper left graphs), left ventricular end-diastolic volume index (LVEDVI, upper right graphs), B-type natriuretic peptide (BNP, left lower graphs), and regional scar volume of left circumflex artery (right lower graphs).

