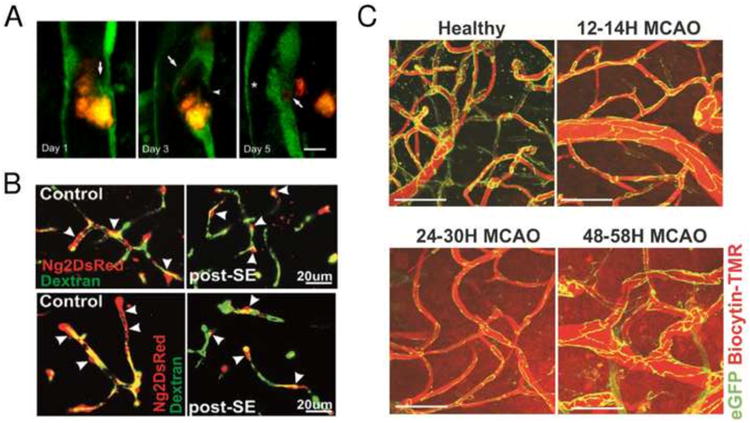
Fig. 3.

Imaging vascular morphology. (A) Focal endothelial remodeling underlies the translocation of emboli. Time-lapse MPM imaging in Tie2–GFP mice shows the gradual extension of a membrane from the adjacent endothelium (arrow, day 1) eventually surrounding a cholesterol embolus (orange) (arrow, day 3). The original endothelium undergoes retraction (arrowhead, day 3) creating a path for embolus translocation. On day 5 the embolus has extravasated, leading to lumen recanalization (asterisk). Scale bar = 10 μm. Adapted with permission from Lam et al. (2010). (B) Pattern of NG2DsRed cerebrovascular coverage after severe status epilepticus (SE) in vivo imaged by MPM. In control NG2DsRed transgenic mice, approximately 60–80% of the cortical microvessel surface is covered by pericytes. FITC-dextran was used to visualize the cerebrovascular tree. Following severe SE (post-SE), retraction of NG2DsRed pericyte ramification was observed. Arrowheads indicate pericyte soma. Adapted with permission from Milesi et al (2014). (C) Integrity of cortical blood vessel tight junctions is impaired at late but not early time points after transient MCAO in live Tg eGFP-Claudin5 mice. Maximum intensity projections of 120-μm-thick cortical volumes from healthy mouse brain, 12–14 hr, 24–30 hr, and 48–58 hr after reperfusion obtained with two-photon imaging through a cranial window in a stroke core region. Scale bar = 50 μm. Adapted with permission from Knowland et al (2014).
