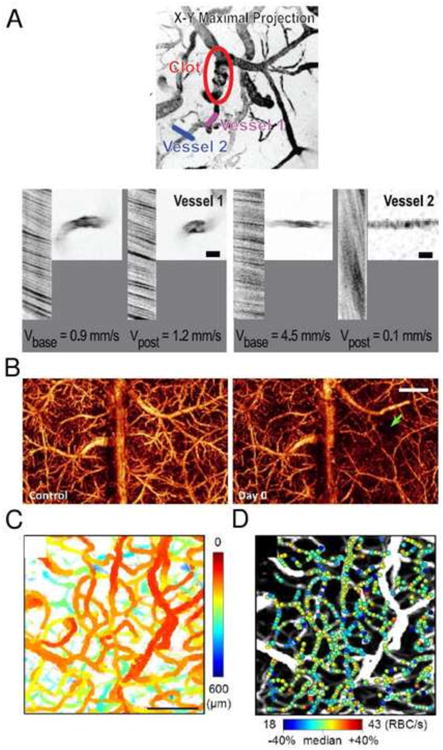
Fig. 4.

Imaging of cerebral blood flow. (A) MPM images of blood flow redistribution in vessels in the immediate neighborhood of the clot in the penetrating arteriole in rat somatosensory cortex. The line segments indicate specific microvessels whose velocity and spatial profile were measured before and after the occlusion. High magnification images and line-scan data for indicated vessels are shown before and after induction of a clot. For the latter data, the nonfluorescent RBCs appear as dark streaks on a bright background; the sign and magnitude of the slope of the streaks reflects the direction and speed, respectively, of RBC motion. Adapted with permission from Nishimura et al (2007). (B) Label-free OCT imaging of blood flow. 3D optical microangiography (OMAG) imaging of the mouse cortex between anterior and posterior coronal sutures in vivo at baseline and after traumatic brain injury (TBI). The site of injury is pointed by the green arrow. The scale bar = 1.0 mm. Adapted with permission from Jia et al (2009). (C, D) OCT imaging of RBC flux in cortical capillaries. (C) The enface MIP of the 3D OCT angiogram of rat somatosensory cortex with color indicating the depth from the cortical surface. Scale bar = 100 μm. (D) Estimated RBC flux obtained by analyzing individual RBC passage in time-series OCT data from (C), presented as color spots on the MIP angiogram. Adapted with permission from Lee et al (2013b).
