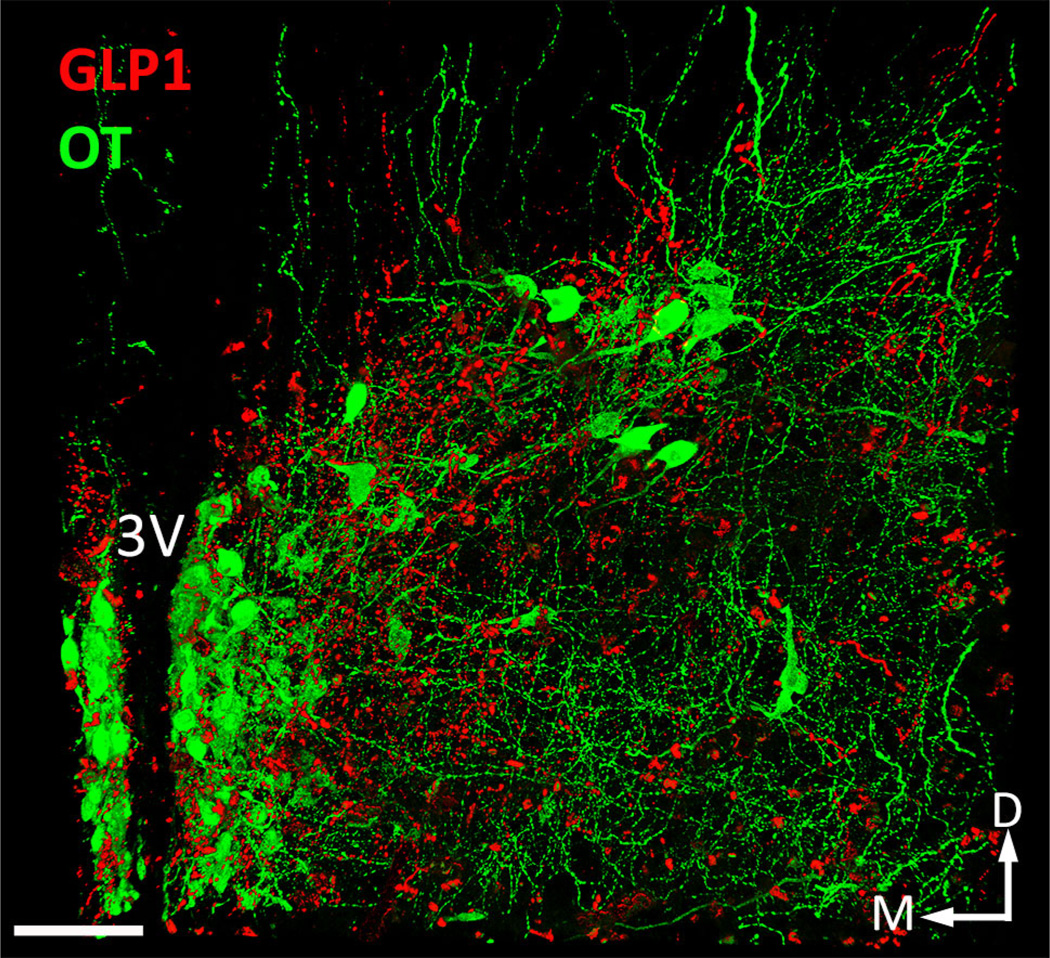
Fig. 4.
Dual IFL for OT (Alexa-647, imaged in green channel) and GLP1 (TSA-Cy3, imaged in red channel) in a 2.0-mm-thick coronal slab through the diencephalon in a juvenile male rat (P24) perfused with Hydrogel solution B. This image is a maximum intensity Z-projection obtained from 268 2.0 µm optical sections (i.e., 536 µm thick). The total image volume is 0.127 mm3 (i.e., 410 µm × 579 µm × 536 µm). 3V third ventricle, D dorsal, M medial. Scale bar 100 µm (color figure online)

