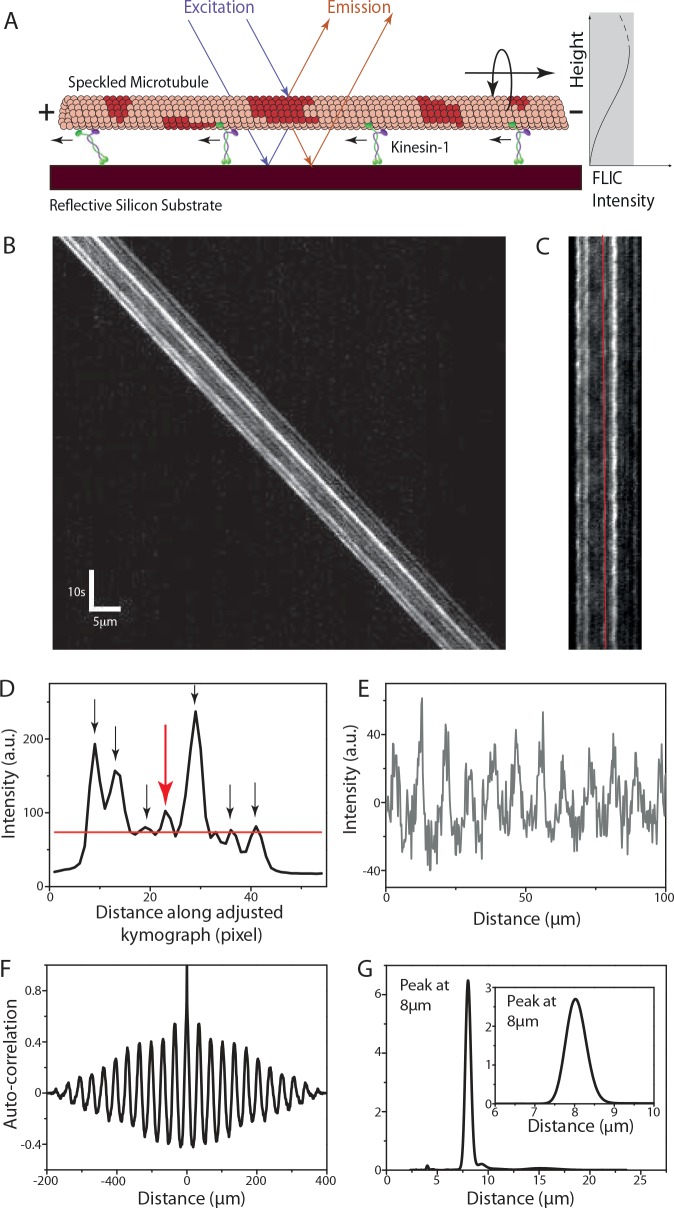
Fig 1. Analysis of the rotational pitch of a speckled MT (S-MT) gliding on kinesin-1.
(A) S-MTs glide on a reflective silicon substrate coated with kinesin-1 motor proteins. Due to fluorescence interference contrast (FLIC), the recorded intensities of the speckles vary as a function of height above the surface. Torsional motion of gliding S-MTs leads to periodic variations in the intensity of each speckle providing information about the rotational pitch. (B) Typical kymograph (space-time intensity plot) of a gliding S-MT. Each individual speckle shows a periodic intensity variation. (C) After background correction, the kymograph is straightened by shifting every time frame by the distance the S-MT moved. (D) Averaged intensity profile along the straightened kymograph from Fig 1C. The red line shows the mean intensity and only speckles with peaks above this line (indicated by the arrows) are analyzed. (E) Relative intensity profile (centered around zero) over distance for the speckle along the red line in Fig 1C and indicated by the red arrow in Fig 1D. This profile is obtained by translating the intensity profile over time to distance in order to account for velocity variations of the gliding S-MT. (F) Auto-correlation for the intensity plot in Fig 1E. (G) Combined power spectral density (PSD) curve for the seven speckles selected in Fig 1D (see S1 Fig for details on the other speckles), with peak at about 8μm. Inset: Power spectrum of the auto-correlation data in Fig 1F, with peak at about 8μm.

