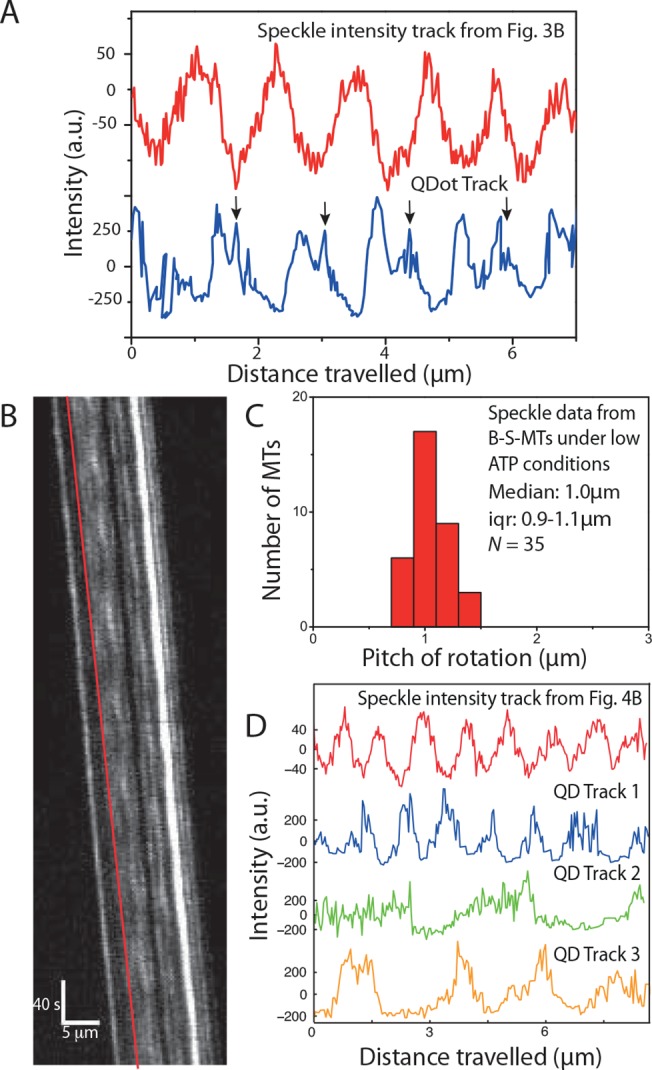
Fig 4. Influence of QDots coupled to MTs gliding on Kinesin-8.

(A) Comparison of a speckle intensity profile from the S-MT shown in Fig 3B (red) and the intensity profile of a QDot on a QD-SA-B-S-MT (blue). In the speckle intensities of the S-MT, the rotational periods are symmetric and regular, in contrast to the QDot signal, which is asymmetric with regular shoulders (indicated with black arrows), suggesting that the QDot interacts with the glass substrate before it can pass between the MT and the surface. (B) Typical kymograph of a B-S-MT gliding on Kip3-eGFP in low (10μM) ATP conditions. (C) Histogram of the rotational pitches of B-S-MTs gliding on Kip3-eGFP in low ATP conditions. Median pitch of rotation is 1.0μm (iqr 0.9–1.1μm; N = 35, where N is the number of MTs). (D) Intensity profile of the speckle on a B-S-MT indicated by the red line in the kymograph in Fig 4B and three example QDot intensity tracks obtained from QD-SA-B-S-MTs gliding on Kip3-eGFP under low ATP conditions. The FLIC intensity data indicates that the speckle on the uncoupled B-S-MT rotates with a pitch of about 1μm while the QDots rotate differently: Track 1 (blue) ≈ 1.1μm, Track 2 (green) ≈ 3μm, Track 3 (orange) ≈ 2.3μm.
