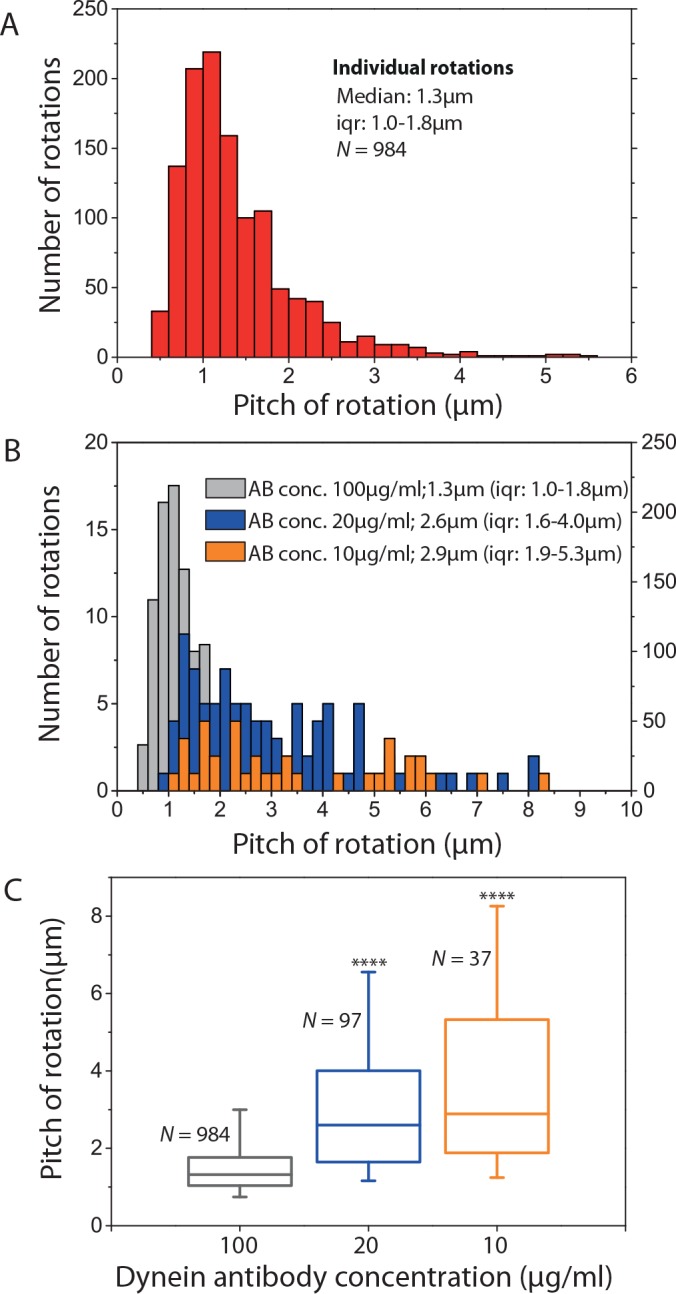
Fig 6. Cytoplasmic dynein driven MT rotations at different motor densities.

(A) Histogram of individual rotations of S-MTs gliding on cytoplasmic dynein (antibody concentration 100μg/ml, analysis of the same kymographs as in Fig 5D except that the individual rotations were picked manually). (B) Histograms of individual rotations of S-MTs gliding on cytoplasmic dynein at different antibody concentrations and thus different motor densities (grey: antibody concentration 100μg/ml, same data as in A, y-axis on the right; blue: antibody concentration 20μg/ml, y-axis on the left; orange: antibody concentration 10μg/ml, y-axis on the left). (C) Box plot of the individual rotations for the three different antibody concentrations (grey: median 1.3μm, iqr 1.0–1.8μm, N = 984; blue: median 2.6μm, iqr 1.6–4.0μm, N = 97, p = 6.6 x 10⁻²⁶ with respect to grey data; orange, median 2.9μm, iqr 1.9–5.3μm, N = 37, p = 1.6 x 10⁻¹³ with respect to grey data). **** corresponds to p < 0.0001.
