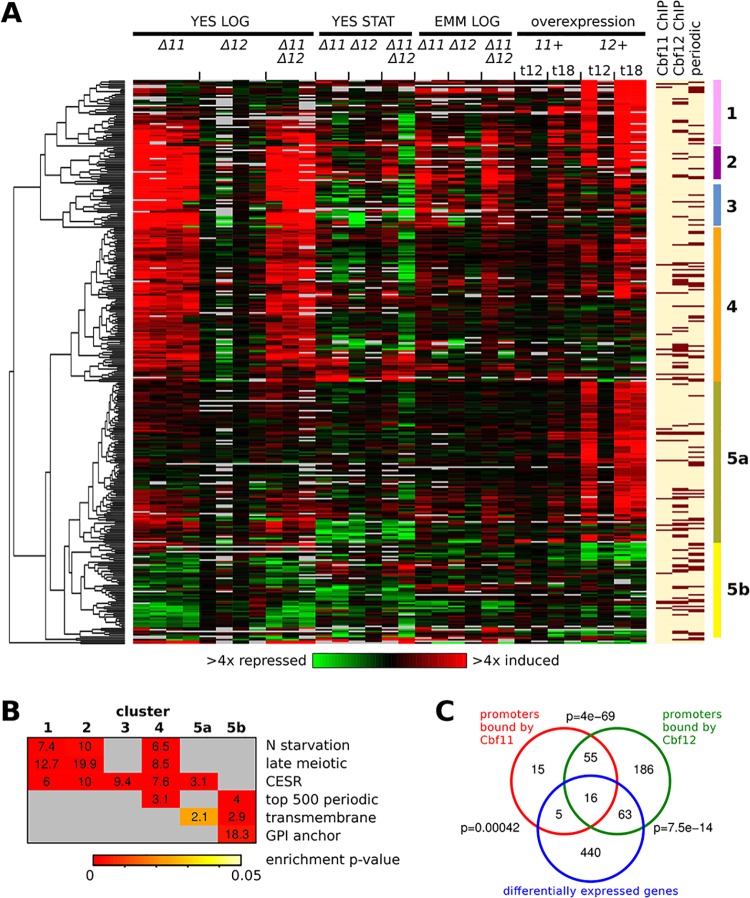
Fig 1. Genes regulated by Cbf11 and Cbf12.
(A) Heatmap of expression ratios of DEGs in CSL knock-outs under several conditions (‘LOG’–exponential growth; ‘STAT’–stationary phase) and during CSL overexpression (‘OE’; 12 or 18 hours post induction). Different data columns under the same condition represent independent biological repeats. The mRNA levels at each condition relative to the levels in wild-type control cells are colour-coded as indicated at bottom, with missing data in grey. CSL binding to the upstream intergenic regions of the respective DEGs, as detected by ChIP-seq from cells growing exponentially in YES, and periodicity of gene expression during cell cycle [47] are indicated at right (dark bars signify CSL binding/periodic expression). Six major DEG clusters (‘1’-‘5a/b’) are indicated by the right-most colour bars. (B) Functional enrichment analysis of the DEG clusters from (A). Numbers in the matrix represent fold enrichment in the cluster compared to all other genes, and the enrichment significance is denoted by the colour of the cell background. ‘N starvation’–genes induced upon nitrogen removal [48]; ‘late meiotic’–genes induced after meiotic divisions [48]; ‘CESR’–core environmental stress response genes [49]; ‘top 500 periodic’–top-ranking 500 genes expressed periodically during cell cycle [47]; ‘transmembrane’–genes coding for transmembrane proteins [50]; ‘GPI anchor’–genes coding for GPI-anchored proteins [51]. (C) Venn diagrams showing overlaps between all CSL DEGs and genes with CSL binding in their upstream intergenic regions, as detected by ChIP-seq from cells growing exponentially in YES. The p-values (one-sided Fisher's exact test) for significance of overlap are indicated.

