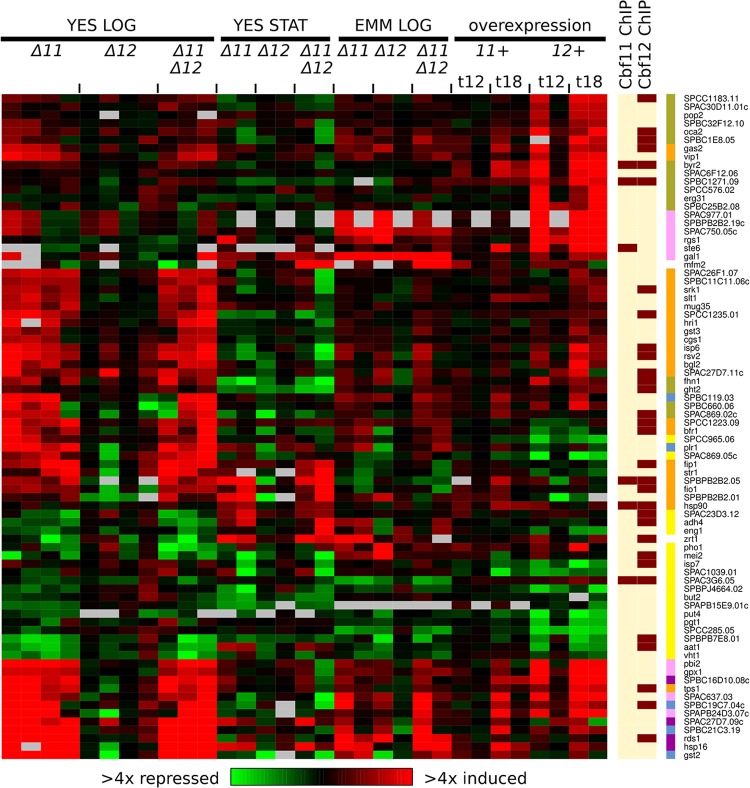
Fig 2. Subset of cell cycle-regulated genes show altered expression upon CSL manipulation.
Heatmap of expression ratios of DEGs (as in Fig 1A) that belong to top-ranking 500 genes expressed periodically during the cell cycle [47]. CSL binding to promoters of respective DEGs, as detected by ChIP-seq from cells growing exponentially in YES, is indicated at right (dark bars signify CSL binding). Cluster membership is indicated by right-most colour bars (colour coding as in Fig 1A).

