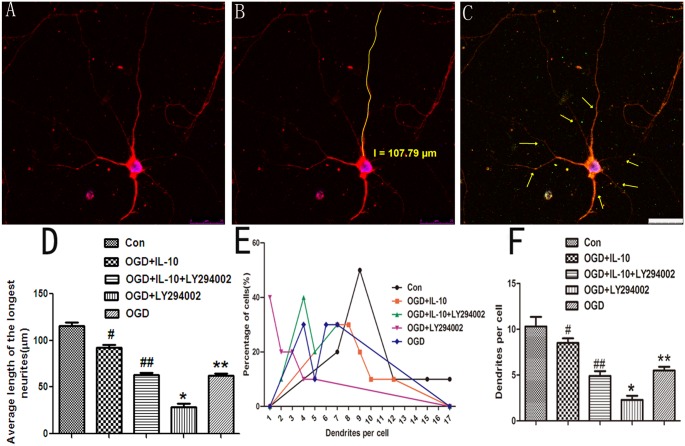
Fig 2. Detection of the axons and dendrites by laser confocal microscopy.
(A) neuron body, cell dendrite (red) and nucleus (blue) were shown. (B) Manually tracing length of the axon (yellow) by the LSM (4.2.0.121) software. (C) Dendrites of neuron (arrows). (D) Quantification of the longest neurites. Data are expressed as mean ± SD (n = 9). **p<0.01 vs CON, #p<0.01 vs OGD group, ##p<0.01 vs OGD+IL-10 group,#p<0.01 vs Control group, *p<0.01 vs OGD group. (E) Frequency distributions of the number of dendrites per projection in each group. (F) Quantification of the maximum dendrites number of neurons. Values correspond to mean± SD (n = 10). #p < 0.01 vs OGD group, *p < 0.01 vs OGD group. Scale bar: 25μm.

