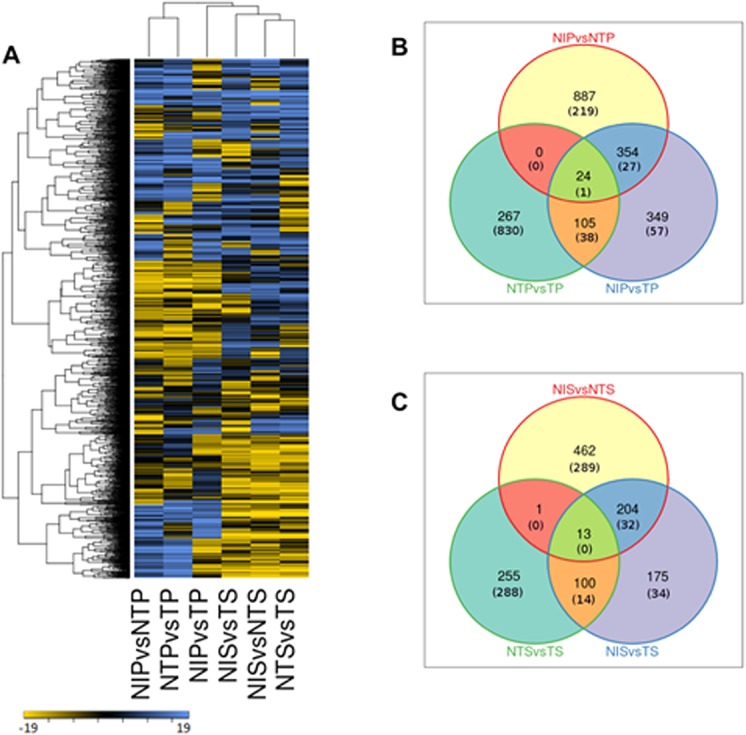
Fig 2. Gene expression profile of cotton in pericarp and seed tissue in response to A. flavus infection.

A) Heatmap showing differentially expressed genes (DEGs) of cotton in response to infection by atoxigenic and toxigenic strains of A. flavus. The up-regulated genes (log2FC> = 2 and P<0.05) and down-regulated genes (log2FC< = -2 and P<0.05) are represented by blue and yellow color, respectively. Genes with similar expression profiles were clustered together by hierarchical clustering. For description of the gene names represented in the heatmaps please refer to the S1 Table, sheet 2. Venn diagram shows the unique and common DEGs in pericarp (B) and seed (C) tissues under different experimental conditions.
