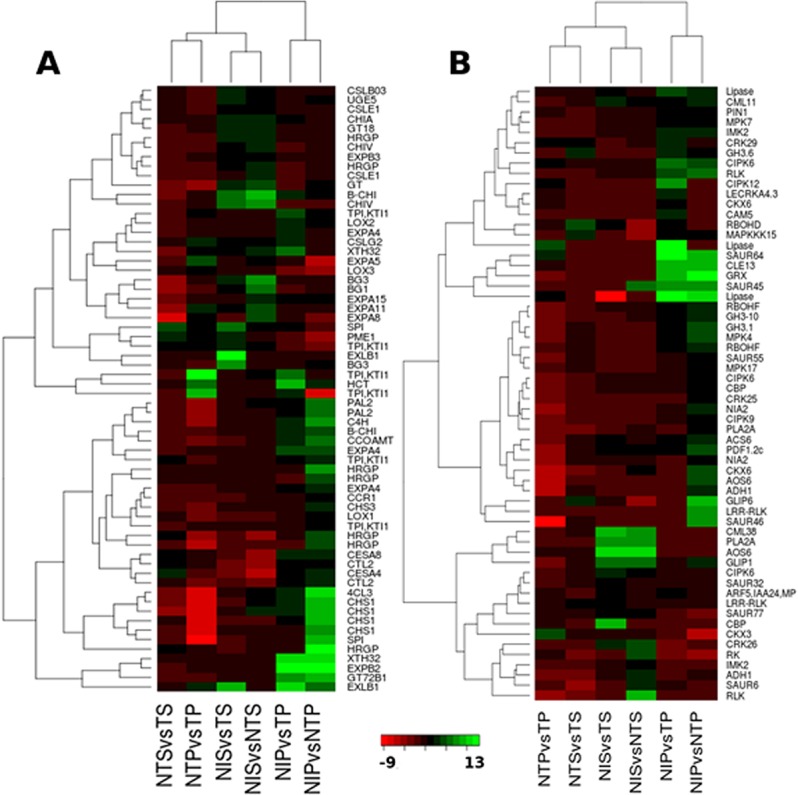
Fig 4. Heatmaps showing DEGs involved in interference of fungal virulence and growth (A) and DEGs involved in defense signaling (B).

The green color represents up-regulated (log2FC≥2) genes and red color represents down-regulated (log2FC≤2) genes. For description of the gene names represented in the heatmaps please refer to the S1 Table, sheet 3.
