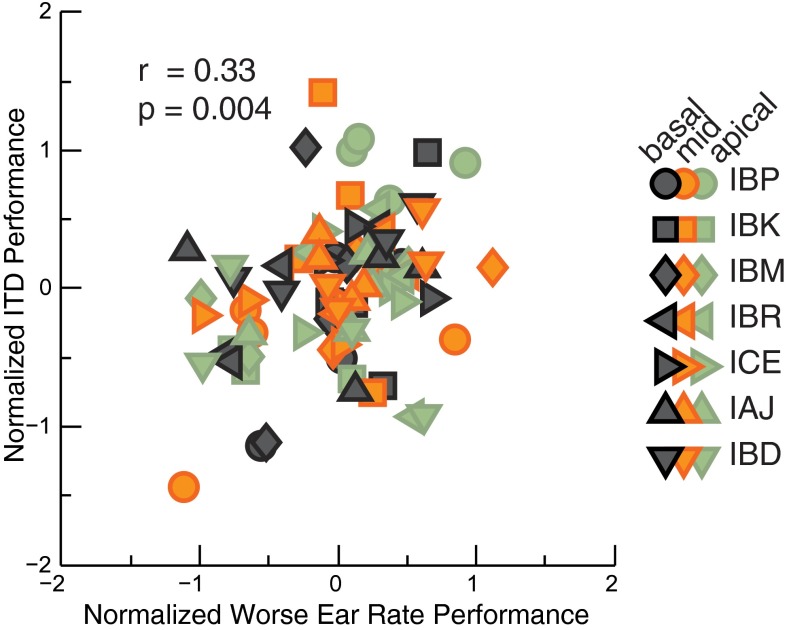
FIG. 2.
Normalized d′norm sensitivity scores for worse-ear rate performance versus ITD (cf. Eq. 4). Different listeners are shown by different symbols, and colors denote the place of stimulation. Repeated symbols reflect the fact that performance is shown across a range of pulse rates.

