Fig. 2.

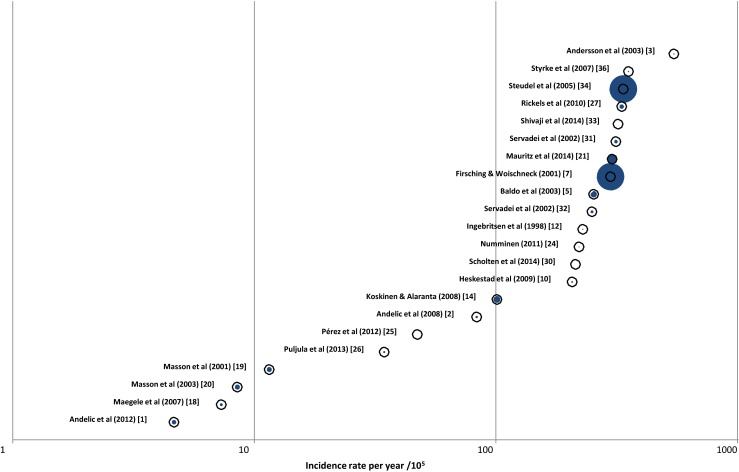
Reported incidence rates for TBI. Rates are expressed per 100,000 population. Each study is marked by an open circle; the size of the blue centre is proportional to the size of the population under study

Reported incidence rates for TBI. Rates are expressed per 100,000 population. Each study is marked by an open circle; the size of the blue centre is proportional to the size of the population under study