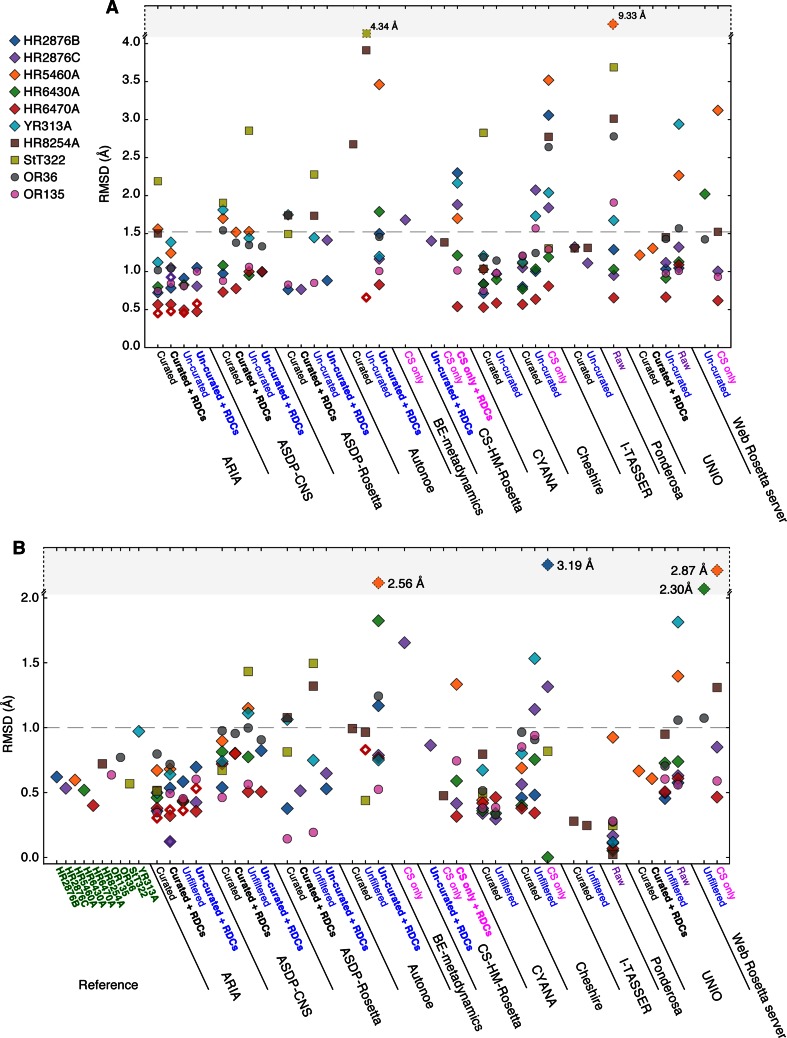
Fig. 1.
Comparison of targets and entries. a Structural similarity (accuracy): the mean all versus all pairwise backbone RMSD for well-defined residues for each of the entries with respect to the target. The dashed line at 1.5 Å indicates a reasonable upper threshold for identity within experimental uncertainty (see text for details). b The pairwise backbone RMSD for well-defined residues within each ensemble for each of the targets and entries. The dashed line at 1.0 Å indicates an estimated upper threshold for a converged structure. Symbols for each target are indicated on the left. Open symbols indicate entries generated from truncated input sequences. Horizontal axis labels: targets are labeled in green, entries generated from curated lists in black, curated lists plus RDCs in bold-black, un-curated lists in blue, un-curated lists plus RDCs in bold-blue, CS only in magenta, CS plus RDCs in bold magenta and raw data in purple

