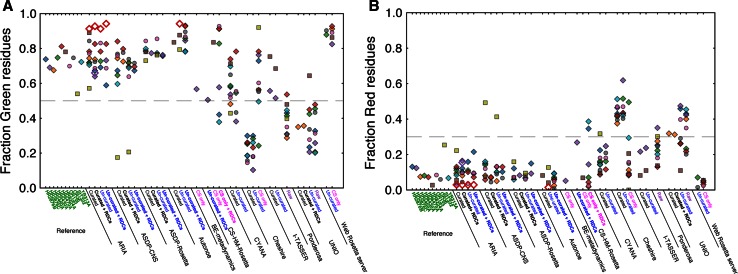
Fig. 3.
ROG scores (Doreleijers et al. 2012a) of the targets and the entries. a The fraction of residues with a green ROG score. The lower threshold of 0.5 is indicated by a dashed line. b The fraction of residues with a red ROG score. The upper threshold of 0.3 is indicated by a dashed line. Symbols and labels are explained in the legend for Fig. 1

