Fig. 2.
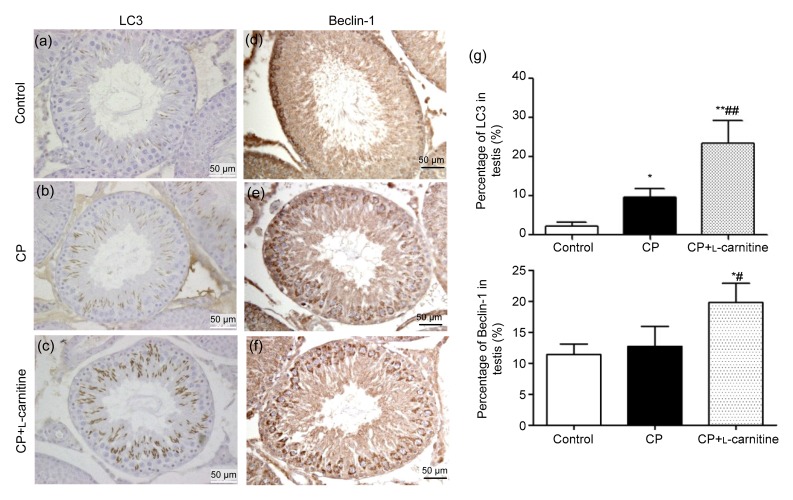
Immunohistochemistry of LC3 and Beclin-1 in testis
Staining of LC3 (a, b, c) and Beclin-1 (d, e, f) in the control, CP, and CP+L-carnitine groups, respectively, and their quantitative values of staining (g). Data are expressed as mean±SD (n=6). * P<0.05, ** P<0.01, compared with the control group; # P<0.05, ## P<0.01, compared with the CP group

