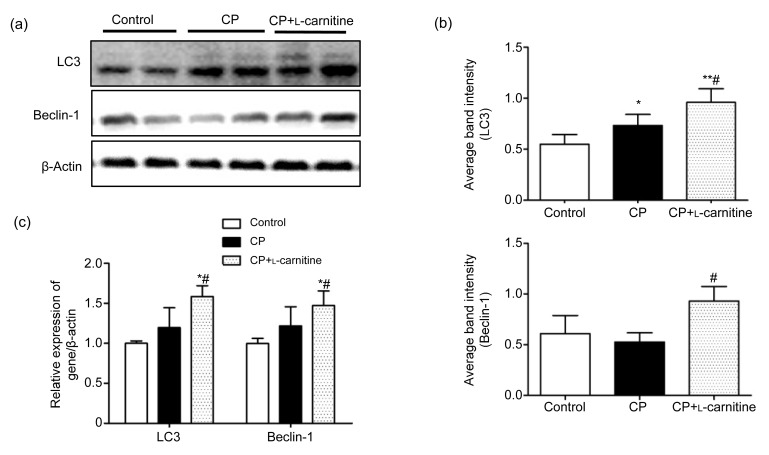
Fig. 4.
Abundances of LC3 and Beclin-1 mRNA and proteins
(a) The typical picture of Western blot analyses of LC3 and Beclin-1 expression in testicular tissue. (b) Quantitative values of Western blot. (c) Relative LC3 and Beclin-1 mRNA levels compared with β-actin. Data are expressed as mean±SD (n=6). * P<0.05, ** P<0.01, compared with the control group; # P<0.05, compared with the CP group

