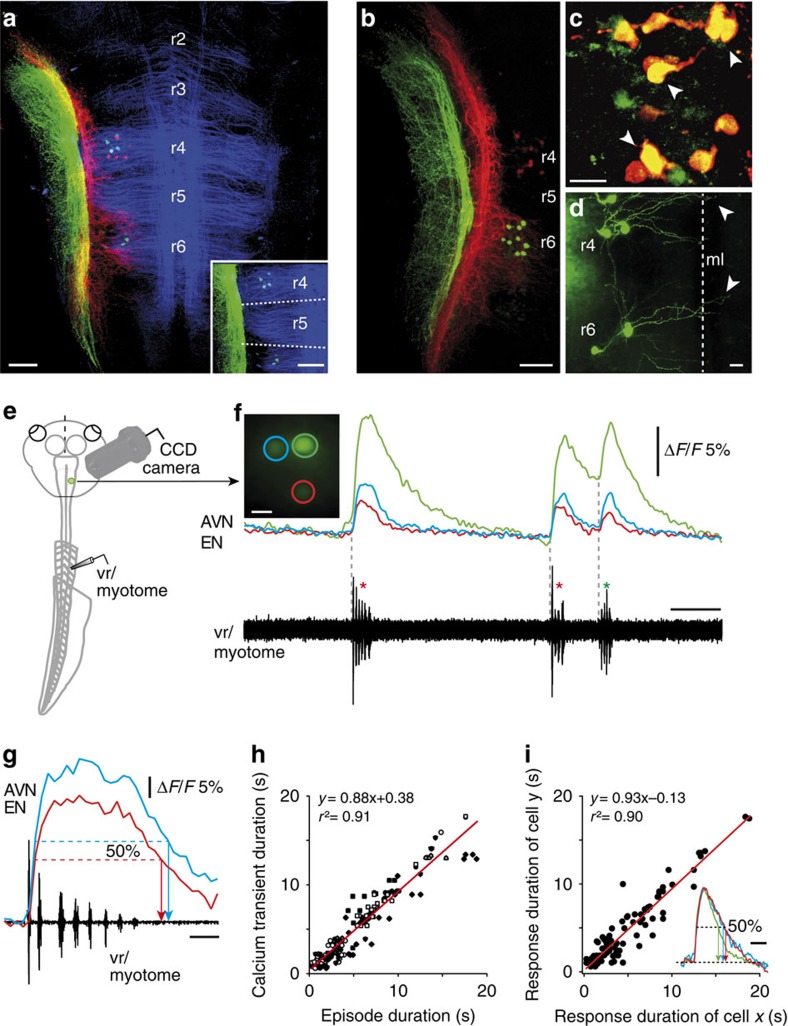
Figure 2. Ca2+ imaging of morphologically identified mechanosensory efferent neurons (ENs) during fictive locomotion.
(a–d) Confocal reconstructions of hindbrain whole mounts after combined application of Alexa Fluor 546 (red) and 488 (green) dextran to the AVN and ALLN (a,c,d) and to the AVN and PLLN, respectively (b) showing afferent axonal projections and locations of EN somata in rhombomeres (r) 4 and 6. Note that the longitudinal and rhombomere-specific transverse fibres (blue in a) were visualized by 612 nm illumination. The inset in a shows r4 and r6 ALLN ENs (green) in relation to segmental boundaries (dashed lines). (c) AVN (red) and ALLN (green) ENs in r4 at higher magnification; note the double-labelled neurons in yellow (arrowheads). (d) ALLN ENs in r4 and r6 that extend dendrites (arrowheads) across the midline (ml). (e,f) Imaging of Ca2+ transients in ENs of semi-isolated preparations (e) following retrograde loading of cell bodies with Calcium Green-1 dextran from the anterior vestibular nerve (AVN). Ca2+ transients (f) were recorded simultaneously in several ENs (colour-coded cells and traces) during episodes of evoked (red *) and spontaneous (green *) ventral root/myotomal locomotor burst activity (black traces). (g,h) Correlation between Ca2+ dynamics, measured as the overall response half-width (g) and corresponding locomotor episode duration (h) in 32 cells during 4–7 swimming episodes per monitored cell (n=160). (i) Plot of Ca2+-response durations (measured as half-width; see colour-coded, normalized transients in inset) of 25 EN pairs during 4–7 locomotor episodes per cell (n=114). Red lines in h and i represent linear regression. Calibration bars: 0.1 mm in a and b and inset in a; 25 μm in c and d; 15 μm in f; 5 s for traces in f and inset in i; 0.2 s in g.

