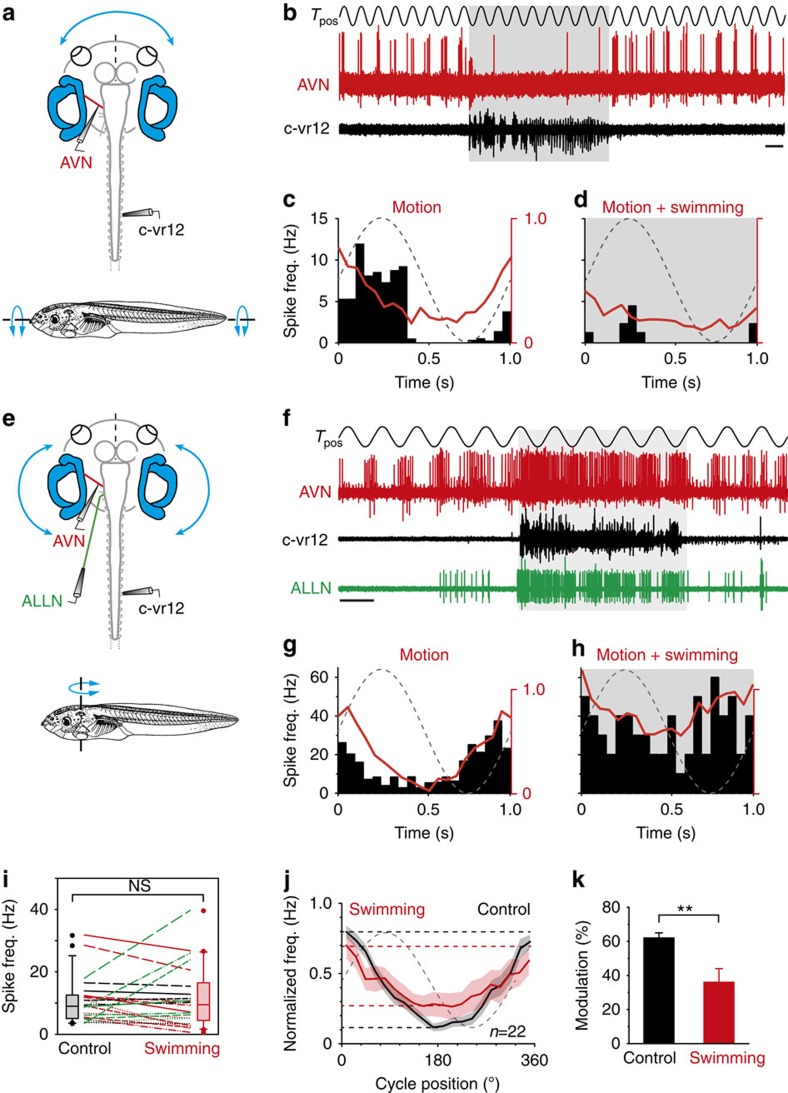
Figure 6. Locomotor corollary discharge influence on vestibular sensory encoding.
(a–h) Recordings of right vr12 (black traces in b and f), the left ALLN (green trace in f) and en passant recordings of afferent fibres in the left AVN (red traces in b and f) in semi-isolated preparations with intact inner ear hair cell–vestibular nerve connectivity (a,e) during sinusoidal (1 Hz, ±60° s−1) horizontal-axis roll motion (a) or vertical-axis head rotations (e) imposed by a two-axis turntable (Tpos). During fictive swimming (shaded areas in b and f), the firing of some vestibular afferent fibres was attenuated (b–d), but facilitated in others (f–h). (c,d,g,h) Histogram (black bars) depicting the mean afferent firing rate modulation (responses of fibres recorded in b and f) over a single cycle of turntable motion (dashed lines) in the absence (c,g) and presence (d,h) of locomotor CPG activity; also plotted are the respective population averages (red curves) of fibres with decreasing (c,d) and increasing firing (g,h) during swimming activity. (i) Plots of individual mean firing rate alterations during motion stimulation (green—increase, red—decrease and black—no change) before (control) and during swimming activity. Grey and red boxes with whisker plots show the distributions of the average firing rates in the two conditions. NS, not significant. (j,k) Averaged response of all recorded afferent fibres (±s.e.m., shaded areas in j; n=22) over a single cycle of turntable motion (dashed grey line) before (black plot) and during (red plot) locomotor CPG activity (j). (k) Averaged extent (error bars represent s.e.m.) of firing rate modulation before (control) and during fictive swimming. (k) **P≤0.001 (Wilcoxon signed-rank test). Horizontal calibration bar in b and f: 1 s.

