
Figure 3.
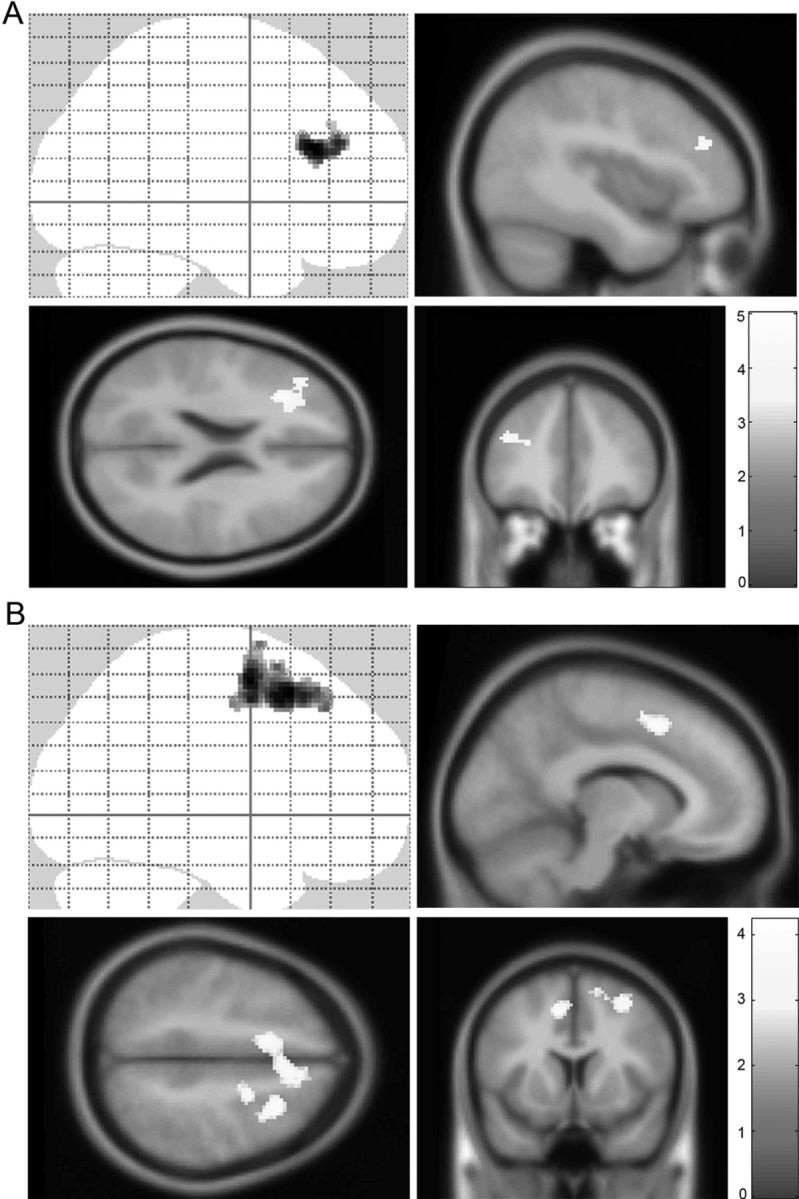
fMRI results. A, MT leads to greater left dorsolateral prefrontal cortex responses during task processing than in SRL. Post hoc analysis further revealed this effect to be driven by increases in the MT group. Top left, Sagittal image from SPM “glass brain,” which demonstrates spatial extent of activations throughout all slices of the brain simultaneously. The color bar indicates the t statistic associated with each voxel. A whole-brain statistical parametric map (in yellow) is displayed superimposed on sagittal, axial, and coronal views of the standard SPM T1-weighted template, for group by time interaction on the task (incongruent + congruent) > passive view contrast. pFWE = 0.03 corrected on cluster level. The voxel selection threshold is p = 0.001. B, Positive correlation of MT practice and midcingulate cortex and premotor area activation during the task-by-emotion contrast. Post hoc analysis revealed this effect driven by positive correlations in the MT group. A whole-brain statistical parametric map (in yellow) for group by time interaction on the task > emotion contrast is displayed superimposed on coronal and sagittal sections of the SPM T1-weighted template. For the exploratory analysis, cluster selection is p = 0.01; pFWE = 0.01.