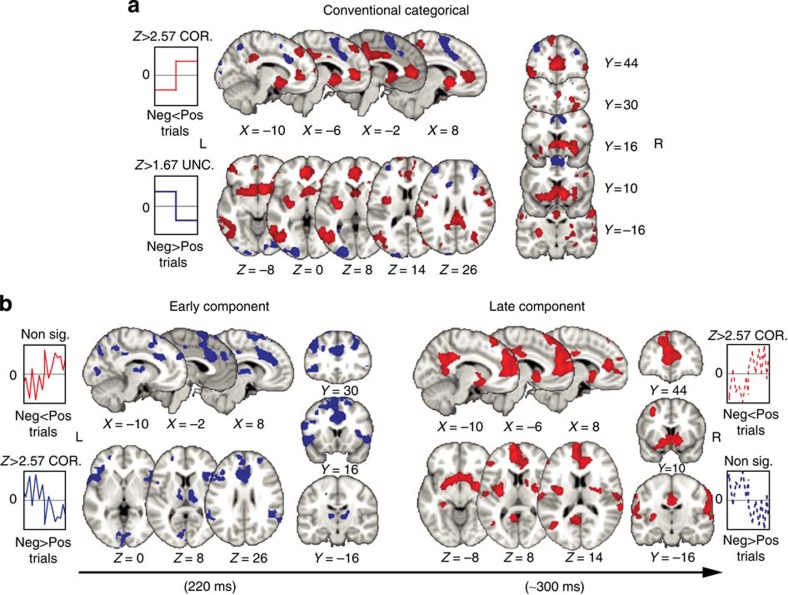
Figure 2. Spatiotemporal characterization of the Early and Late value systems.
(a) A distributed network of activations including areas showing greater BOLD response for positive than negative outcomes (red clusters, mixed-effects (n=20), Z>2.57, corrected) and areas showing greater BOLD response for negative than positive outcomes, albeit at a more lenient threshold (blue clusters, mixed-effects (n=20), Z>1.67 uncorrected) using a conventional categorical outcome regressor (Supplementary Table 1). (b) A parametric regressor, based on the EEG STV in the Early value component, absorbed all activations that appeared in the conventional analysis in (a) exhibiting greater response for negative compared with positive outcomes (blue clusters) and additional unique activation clusters showing the same overall response profile (Neg>Pos; Supplementary Table 2). A parametric regressor based on the EEG STV in the Late value component, absorbed exclusively the activations that exhibited greater response for positive compared with negative outcomes in the conventional analysis in (a) (red clusters), including additional unique clusters showing the same overall response profile (Pos>Neg; Supplementary Table 2). All activations represent mixed-effects (n=20) and are rendered on the standard MNI brain at Z>2.57, corrected using a resampling procedure (minimum cluster size=76 voxels; see Methods).

