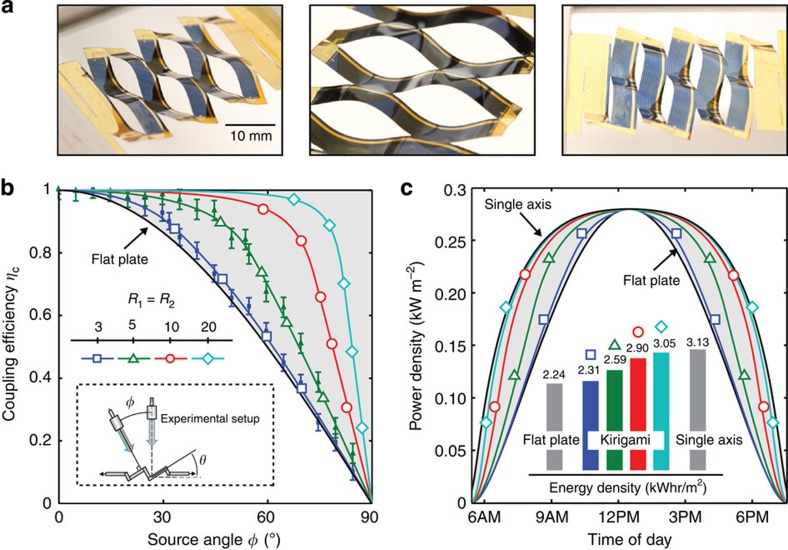
Figure 4. Tracking performance for GaAs kirigami trackers.
(a) Integrated thin-film, crystalline GaAs solar cells, mounted by cold weld bonding on a Kapton carrier substrate, as used for testing. Here, LC=15 mm, x=5 mm and y=5 mm (R1=R2=3). (b) Normalized solar cell short circuit current density JSC(φ)/JSC(φ=0) for two samples, where R1=R2=3 and R1=R2=5 (closed symbols). Also shown are the simulated data for coupling efficiency (ηC) obtained from equation (4) (solid lines, open symbols). The agreement between experimental and simulated results suggests that ηC is a direct measure of optical coupling, and that performance may be optimized by increasing R1 and R2. (c) Output electrical power density incident on the solar cell versus time of day for several kirigami cut structures, stationary panel and single-axis tracking systems in Phoenix, AZ (33.45° N, 112.07° W) during the summer solstice. Inset: Integration of the curves yields the associated energy densities, where kirigami-enabled tracking systems are capable of near single-axis performance.

