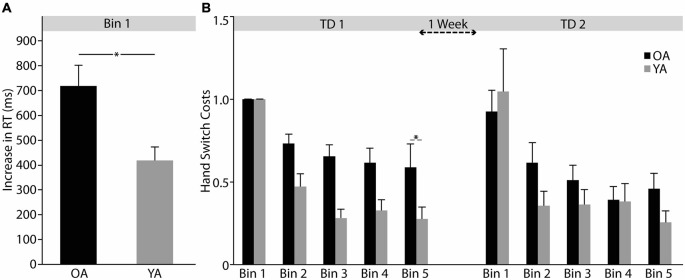
Figure 3.

Hand switch costs. (A) Differences in initial hand switch costs (Bin 1) between younger (YA) and older (OA) adults. (B) Learning-related changes in hand switch costs for training day 1 and 2 (TD1 and TD2). For details see text. Response time (RT); One Bin consists of averaged data from six repetitions of the learning sequence. Error bars represent mean ± standard error of the mean, *p < 0.05.
