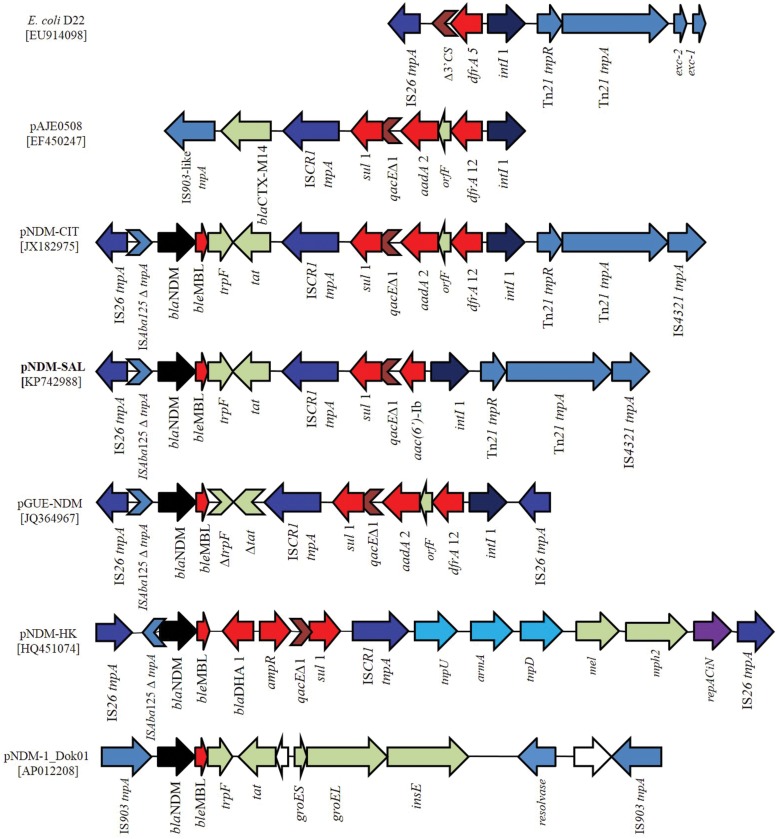
FIGURE 4.
Schematic representation of the DNA sequences surrounding the blaNDM-1 genes in pNDM-SAL compared to the sequences in E. coli D22 (EU914098), pAJE0508 (EF450247), pNDM-CIT (JX182975), pGUE-NDM (JQ36496), pNDM-HK (HQ451074), and pNDM-1_Dok01 (AP012208). Arrows showed the direction of transcription. Gaps between the ORFs are indicated by straight line. The same color and label are used to represent homologous genes. blaNDM-1 are denoted by black color and other resistance genes as red color. All transposons and IS elements are indicated in shades of blue. Other ORFs are denoted by light gray and white. Violet arrow indicates the repAciN gene.

