
Figure 3.
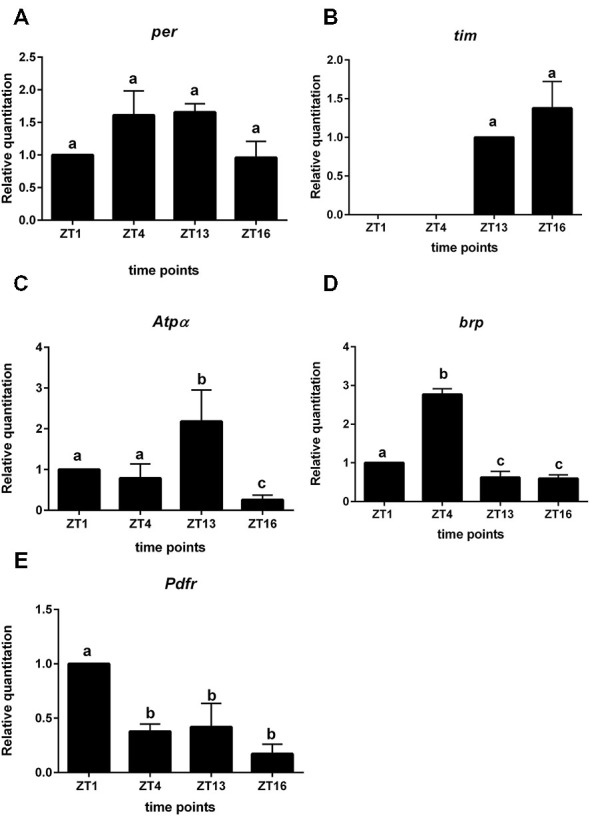
Gene expression in L2 interneurons labeled with GFP (21D > gfp strain). A—per gene; B—tim; C—Atpα, D—brp, E—Pdfr. Cells were isolated at four time points: ZT1, ZT4, ZT13, ZT16 in LD 12:12. RQ determines the changes in mRNA level and data are normalized to ZT1 (value = 1.0). Statistically significant differences are marked by different letters (A–C) above bars.