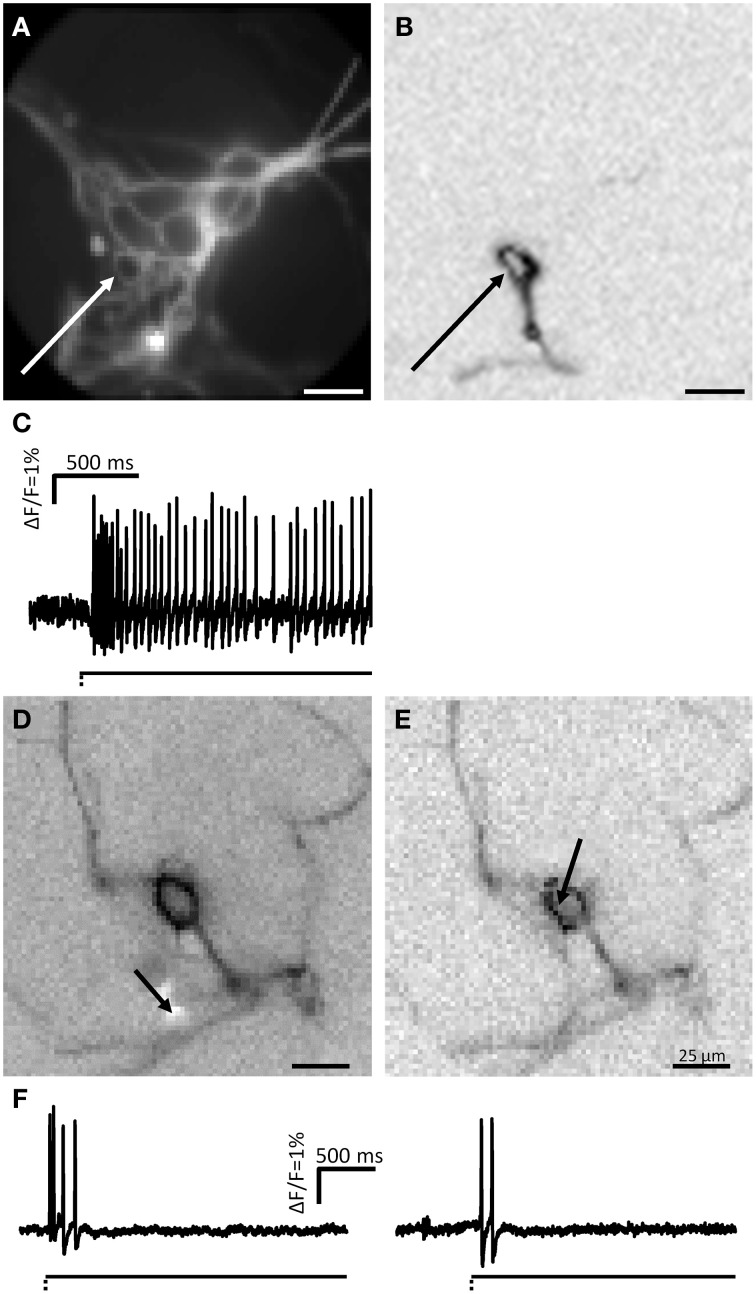
Figure 7.
MEN fire action potentials after soma deformation. (A) Shows a picture taken by the CCD camera of a cluster. The soma of one neuron was deformed at the spot marked by a white arrow. In (B) the ICA image of the deformed neuron is displayed. (C) Shows the spike discharge pattern of this neuron. Paired stimulation (soma and neurite of the same neuron) showed that electrical signal was conducted in the same number of processes. (D,E) Show the ICA images of one neurons stimulated on a neurite (D) and on the soma (E) revealed the same number of neurites. (F) Shows the spike discharge corresponding to the neurite and soma stimulations, respectively.

