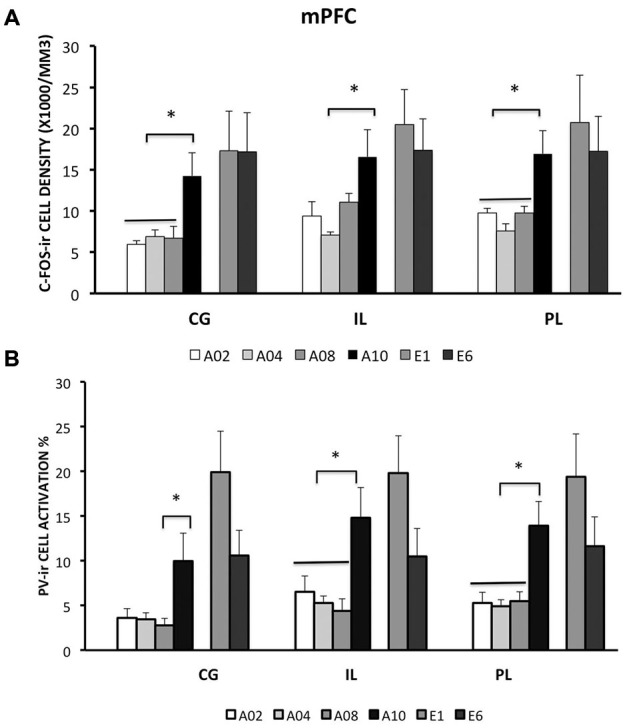
Figure 2.

Densities of c-Fos-ir cells and the percent of activated PV-ir cells in the medial prefrontal cortex (mPFC) (cingulate cortex, Cg; prelimbic cortex, PL; and infralimbic cortex, IL), were depicted. (A) Densities of c-Fos-ir cells in mPFC sub-regions. (B) Activation of PV-ir cells in the mPFC. Each data point represents group mean ± S.E.M. (*ps < 0.05; n = 7–8/group).
