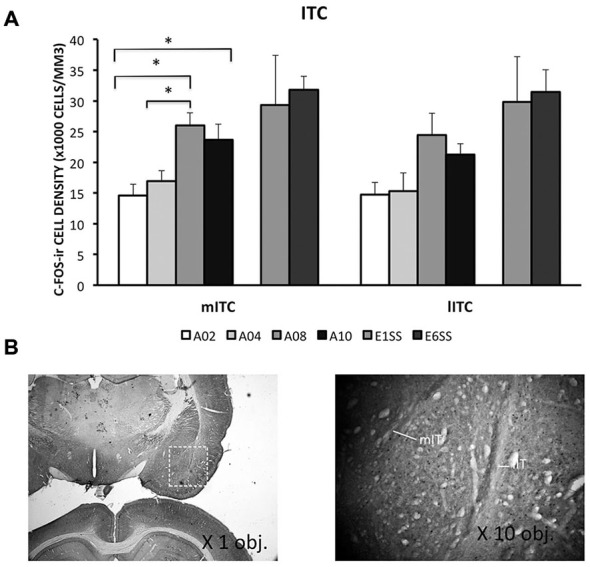
Figure 4.

Densities of c-Fos-ir cells in the lateral and medial intercalated cell cluster (ITC) were depicted. (A) Densities of c-Fos-ir cells in the lITC and mITC. Each data point represents group mean + S.E.M. (*ps < 0.05; n = 5–6/group). (B) mITC and lITC were defined by GAD67 staining that was visualized by DAB (×1.25 objective lens). C-Fos-ir cells in the mITC and lITC were visualized by DAB-NiCl2.(×40 objective lens).
