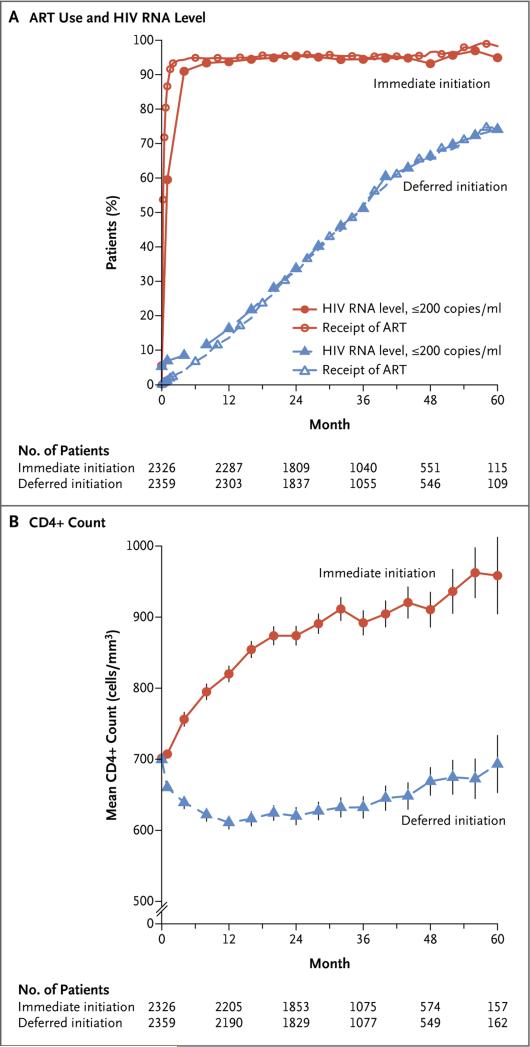
Figure 1. Antiretroviral Therapy, HIV RNA Suppression, and CD4+ Count.
Shown are the percentages of patients who were receiving antiretroviral therapy (ART) and the percentages of patients who had an HIV RNA level of less than 200 copies per milliliter (Panel A) and the mean CD4+ count (Panel B) in the immediate-initiation group and the deferred-initiation group over a 5-year period. The vertical lines around the data points in Panel B indi cate 95% confidence intervals. Once ART was initiated, appropriate changes in regimens were mandated in cases of treatment-limiting adverse drug reactions or if the existing regimen did not fully suppress viral replication. Additional details regarding study-specified initial regimens of antiretroviral therapy and the frequency of specific antiretroviral drugs that were used in the initial regimens are provided in Section 3 and Table S2 in the Supplementary Appendix.

