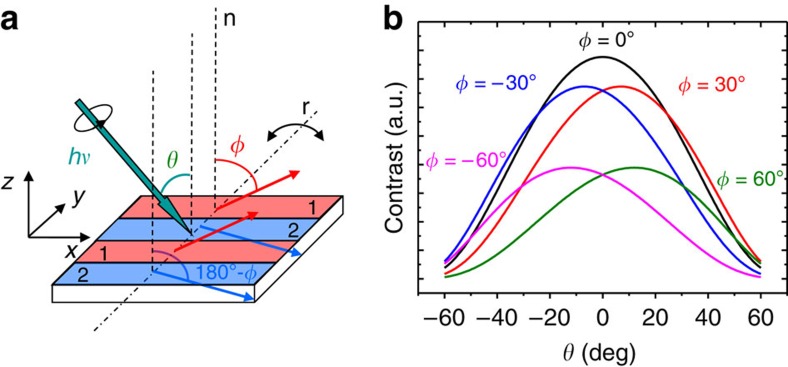
Figure 1. Angular dependent magnetic transmission X-ray microscopy configuration.
(a) Experimental transmission X-ray microscopy measurement geometry and sketch of the magnetization configuration in a parallel stripe pattern; alternate stripes, denoted as 1 and 2 and shown in red and blue colours, respectively, have opposite Mz components but the same Mx, as indicated by the red and blue arrows, that correspond to the magnetization direction in each stripe; θ is the angle between the incoming photon beam (indicated by a green arrow and having hν energy) and the sample surface normal direction (vertical dotted lines denoted as n); φ is the angle between domain 1 magnetization and n direction; sample rotation axis (dashed–dotted line, denoted as r, parallel to the y axis and contained in the sample surface plane) allows to vary θ. (b) Calculated contrast curves C(θ, φ) versus X-ray beam orientation (θ) for different domain configurations (φ values). For φ≠0, the maxima become displaced to positive or negative values depending on the sign of φ.

