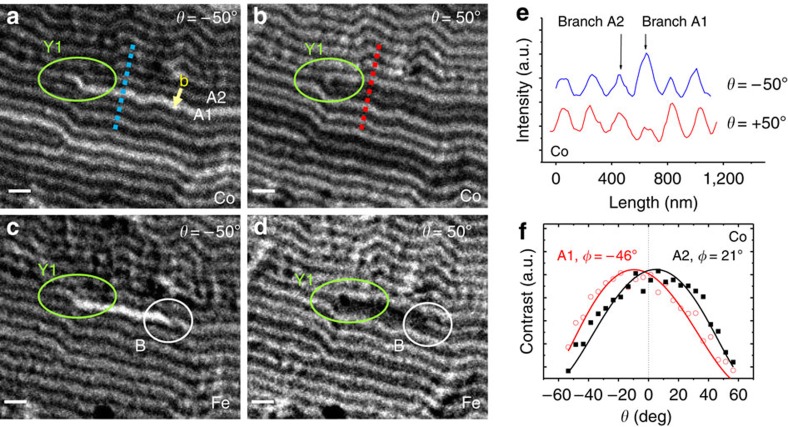
Figure 4. Characterization of an individual dislocation with a meron spin texture at the core.
3.3 × 2.8 μm2 magnetic images of NC55P40 around dislocation Y1 (shown in green): (a,b) Co magnetization at θ=−50° and +50°, respectively; note the different contrast between the lower, A1, and upper, A2, branches of dislocation Y1, that indicate Mx reversal starting at the dislocation core; Burgers vector b starting at branch A2 and ending at branch A1, is indicated in yellow in panel (a). (c,d) Fe magnetization at θ=−50° and +50°, respectively; white circle B highlights a sharp contrast change in branch A1 of Fe images; note the shorter Y1-B segment in (c) in comparison with the reversed branch A1 in (a). Scale bars, 300 nm. (e) Co magnetization intensity profiles across branches A1 and A2 along the dotted lines shown in panels (a,b). (f) Co edge contrast versus θ curves corresponding to branches A1 and A2, average canting angles are also indicated.

