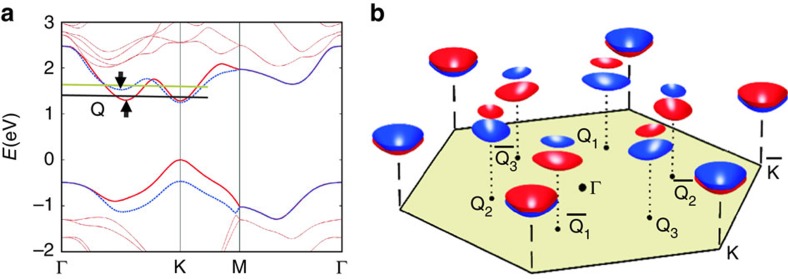
Figure 2. K and Q valleys in ML WSe2.
(a) Electronic bands of ML WSe2 calculated by DFT. In the bottom conduction and top valence bands, the spin-down and -up subbands are denoted by red and blue colour, respectively. The vertical arrows point to the minima of the spin-split bands at Q valley. The two horizontal lines mark the energies at which the constant energy contour maps in Figs 3d and 4c are obtained. (b) Schematic illustration of the spin–valley-coupled conduction-band edges, where the blue and red colours denote the spin-up and spin-down bands, respectively.

