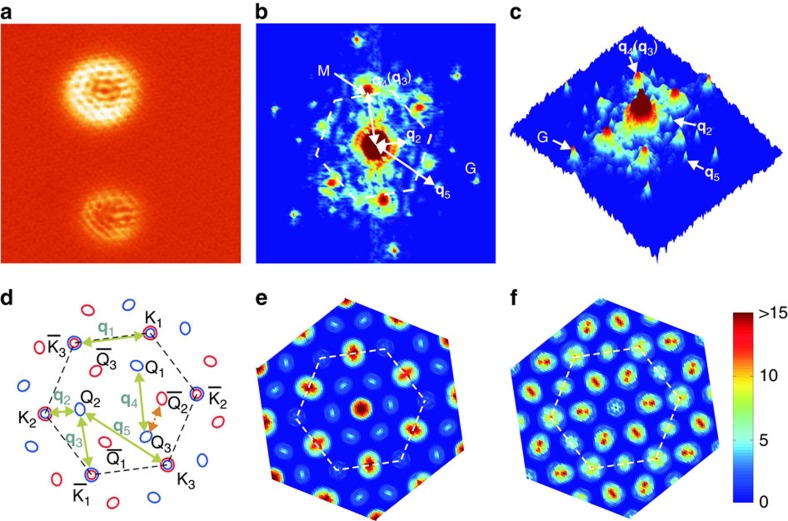
Figure 3. Intervalley quantum interference at defects.
(a) STS map of ML WSe2 at +1.0 eV of the same surface as in Fig. 1c, showing QPI patterns in the vicinity of the two point defects. (b,c) The FT-STS map in (a) presented in the top and perspective views, respectively. The white dashed hexagon in (b) shows the first Brillouin zone . The observed scattering wave vectors (qis) are exemplified by arrowed solid white lines in (b) and pointed in (c). The central ring-like feature as highlighted by the yellow dotted circle in (b) may reflect the intravalley scattering. (d) Constant energy contour at the energy marked by the black horizontal line in Fig. 2a. The blue (red) colour denotes the up (down) spin states. The solid green arrows indicate five possible spin-conserving scattering channels with the resulting interference wave vectors qi. The dashed orange arrow indicates a spin-flipping scattering channel. (e,f) Calculated joint density of states for, respectively, spin-conserving and spin-flipping scatterings at the same energy as in (d).

