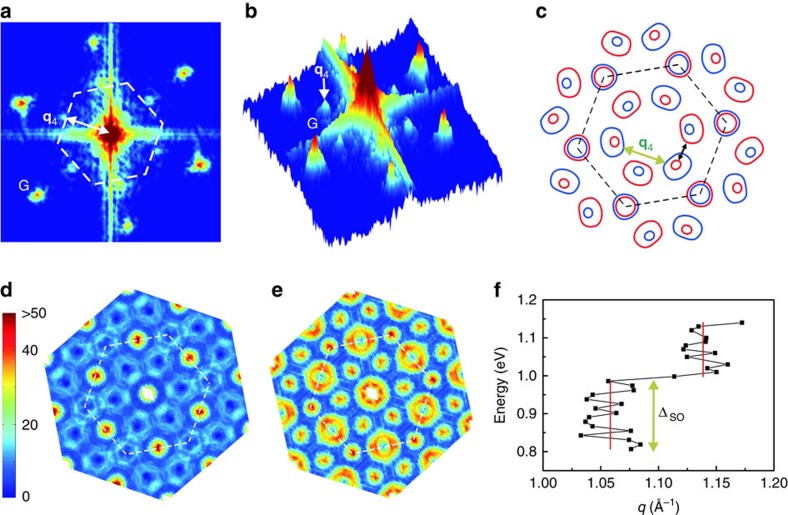
Figure 4. Energy dependence of the quantum interference pattern.
(a,b) FT-STS map of the surface as in Fig. 3 but measured at energy +1.2 eV and presented in the top and perspective views, respectively. (c) Constant energy contour at an energy marked by the horizontal green line in Fig. 2a, where the blue (red) line denotes the up (down) spin states. The solid green arrow indicates a spin-conserving Qi−Qj scattering channel. The black arrow indicates a spin-conserving  intervalley scattering channel, as both spin-up and -down subbands at Q valleys are relevant at this higher energy. (d,e) The joint density of state maps calculated for, respectively, spin-conserving and spin-flipping scatterings at same the energy as in (c). (f) Experimentally derived wave vectors (q4) from the FT-STS maps at different energies (from 0.7 to 1.2 eV), revealing two branches as highlighted by the solid red lines. The vertical green arrow indicates the magnitude of spin splitting at Q.

