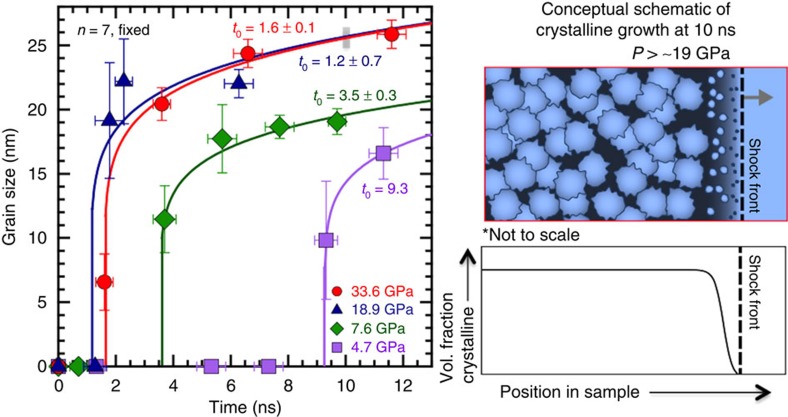
Figure 4. Experimentally determined average grain sizes as a function of delay time.
Different colours/symbols are for SiO2 at different applied pressures. Fits are from a simple growth model. Cartoon on the right (for 33.6 GPa at 10-ns delay, grey box) illustrates our interpretation of grain growth behind the shock front (black dashed line, propagation direction is grey arrow) showing a distribution of grain size increasing with distance from the shock front. A qualitative trend for probable grain density23 as function of time (or distance) is also shown.

