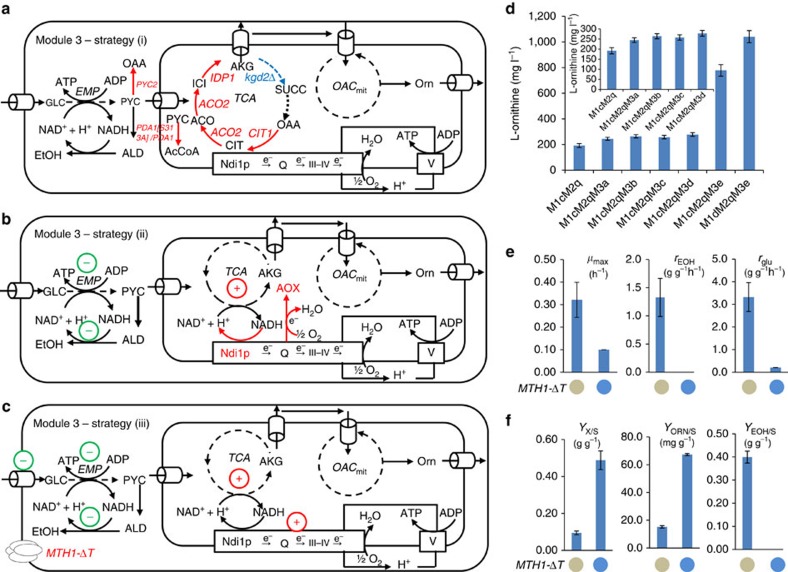
Figure 4. Attenuation of the ‘Crabtree effect' improves carbon channelling to L-ornithine (Module 3).
To overcome the ‘Crabtree effect' we evaluated three different strategies: (a) strategy (i) overexpression of TCA cycle genes involved in the biosynthesis of α-ketoglutarate; (b) strategy (ii) improving consumption of NADH generated in connection with α-ketoglutarate biosynthesis; and (c) strategy (iii) attenuating the glucose uptake rate and hereby reducing overflow metabolism to ethanol. See Fig. 1 legend regarding abbreviations of genes and metabolites. (d) Strains with variant pathways in Module 3 led to increased production of L-ornithine. Cells were grown in defined minimal medium with 20 gl−1 glucose and cultures were sampled after 72 h of growth for L-ornithine quantification. Exceptionally, cultures were sampled after 108 h of growth for strain M1cM2qM3e and M1dM2qM3e as ΔT-MTH1 overexpression impaired the glucose uptake accompanied by the decreased growth rate. Displayed is the average values±s.d. from at least three biological replicates. (e) Physiological characterization of the strain expressing MTH1-ΔT and the control. The blue solid circle represents the strain harbouring MTH1-ΔT, while the grey one represents the one without MTH1-ΔT. The specific growth rate: μmax (h−1), specific ethanol production rate: rEOH (g ethanol (g DCW)−1 h−1) and specific glucose uptake rate: rglu (g glucose (g DCW)−1 h−1) are shown. All values were calculated in batch culture on glucose during the exponential growth phase. (f) Physiological characterization of the strain harbouring MTH1-ΔT and the control. The blue solid circle represents the strain harbouring MTH1-ΔT, while the grey one represents the one without MTH1-ΔT. The biomass yield on glucose: YX/S ((g DCW) (g glucose)−1), the L-ornithine yield on glucose: YORN/S (mg L-ornithine (g glucose)−1) and the ethanol yield on glucose: YEOH/S (g ethanol (g glucose)−1) are shown. All values were calculated in batch cultures on glucose during the exponential growth phase. All data are presented as the mean±s.d. (n≥3).

