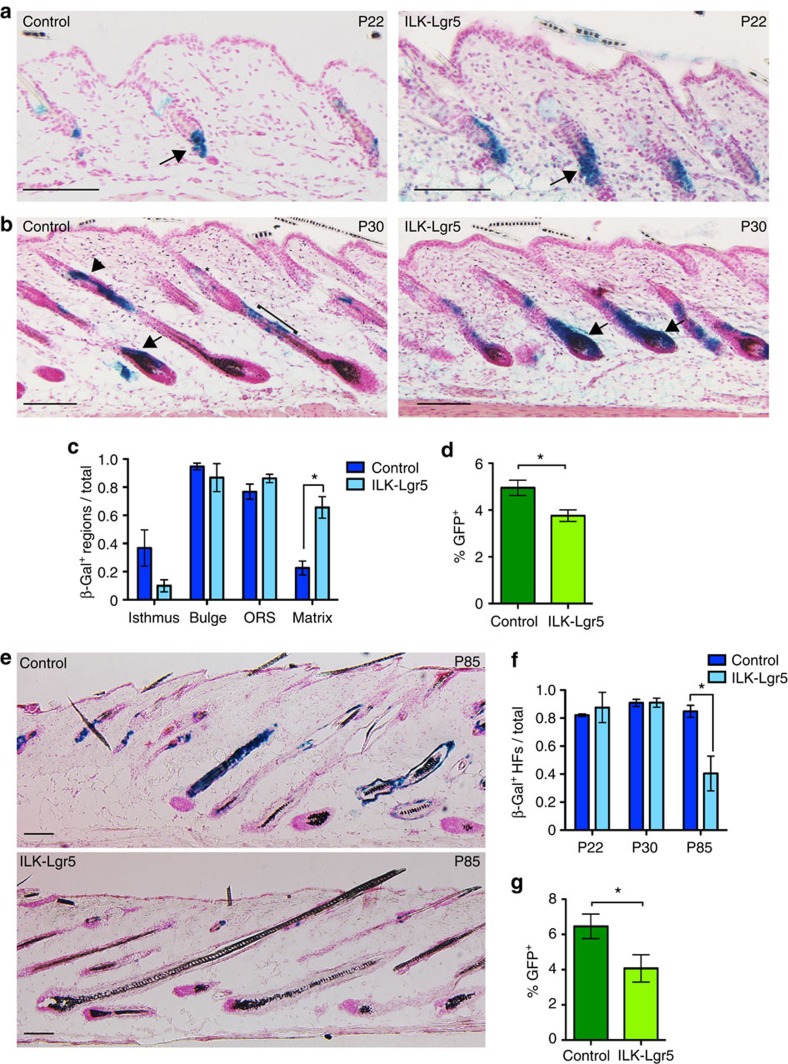
Figure 3. ILK deficiency leads to loss of quiescent SCs through enhanced differentiation.
(a) Lineage-tracing analysis of β-galactosidase-positive Lgr5+ SC progeny of control and ILK-Lgr5Cre mice in P22 skin, directly after 5 consecutive days of tamoxifen application. β-galactosidase-positive Lgr5 progeny are seen in the bulge and secondary germ regions of HFs (arrows) both in controls and ILK-Lgr5Cre mice. Scale bars, 100 μm. (b) After 1 week, (P30) β-galactosidase staining shows Lgr5 progeny in the isthmus (asterisk), bulge (arrowhead), outer root sheath (ORS; bracket) and matrix (arrow) regions in HFs of control skin, whereas in ILK-Lgr5Cre skin the strongest staining is restricted to the matrix of HFs (arrows). Scale bars, 100 μm. (c) Quantification of the proportion of P30 HFs that contain β-galactosidase-positive cells within the regions indicated (mean±s.e.m.; n=4; *P=0.0159, Mann–Whitney). (d) FACS analysis of GFP+ Lgr5-expressing cells shows a reduction in this cell population in P30 ILK-Lgr5Cre mice (mean±s.e.m.; n=7; *P=0.0013, Student's t-test). (e) Lineage tracing of Lgr5 progeny at P85 from control and ILK-Lgr5Cre mice shows positive cells throughout HFs of controls, whereas ILK-deleted mice show strongly reduced staining. Scale bars, 100 μm. (f) Quantification of the distribution of β-galactosidase staining within P22, P30 and P85 HFs. ILK-Lgr5Cre mice show reduced β-galactosidase staining at P85 (mean±s.e.m.; n=4; *P=0.0286, Mann–Whitney). (g) FACS analysis of GFP+ Lgr5-expressing cells shows a reduction in this cell population in P85 ILK-Lgr5Cre mice (mean±s.e.m.; n=4; *P=0.0381, Mann–Whitney).

